20% U-6 Rate by End of 2009: Employment Situation: Economic Indicator of Hours Worked Dropping at Fastest Pace Since 1970s. A Key Financial Leading Indicator. 7 Million Unemployed since Start of Recession.
- 2 Comment
The headline number of 9.4 percent unemployment doesn’t do any justice to the 26,000,000 unemployed or underemployed Americans. Last month, we saw the unemployment situation improve when only 345,000 job losses came online. This sure beats the 500,000+ months we had for six consecutive months. Yet the actual unemployment rate jumped from 8.9 percent to 9.4 percent. This was the highest percentage jump in the recession tying another 0.5 percent monthly jump. So what gives? In a nutshell, companies are not hiring. So yes, job losses may have dropped but there are no new jobs to pick up the currently unemployed so the actual rate increases. This is one of those nuances of the two surveys used by the BLS.
Â
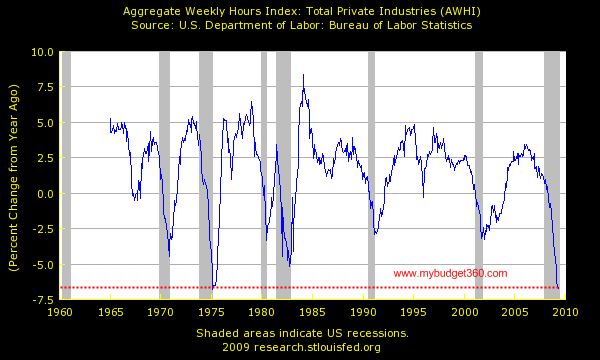
So what can we look at for a better indicator? We should be looking at actual hours being worked. The decline in aggregate hours is the steepest since 1975. Take a look at this chart:
Â
Â
Now this may be the best leading indicator of when the employment situation will really turn around. Given the current market volatility using the stock market as a leading indicator is completely flawed since this is the steepest recession since the Great Depression. Old measures may not work. We also have unique “saved” employment with many places going with furloughs or cutting back on overtime work. Take a look at what happened in January in California with tens of thousands of state workers being furloughed:
“(SacBee)Â Some were furious. Others were sad, even tearful. Many more accepted the news with graceful resignation, trying to hide their worries.
At the end of a week that brought nothing but more grim economic news, that’s how dozens of state workers greeted the state personnel department’s announcement that thousands of California public servants will be furloughed two Fridays a month and lose 10 percent in pay, starting Feb. 6.”
Now how this plays into the employment situation is when things do start picking up, the aggregate amount of hours work will be a first signal of any turnaround. Why? Well think about the furloughs for example. When work does pick up and the economy begins to turn around companies will first go to their currently hired full-time workers and give them more hours.Â
Companies will also offer more overtime when work starts picking up but this will benefit their current employees. So this may not show up in the current employment data since it measures full-time employment and hires and this will only show up initially in aggregate hours. Yet as you can clearly see on the aggregate hours chart above, we are still heading lower. What is fascinating if you look at the gray recession bars above, almost every time once aggregate hours start moving up it nearly indicates the end of the recession for statistical purposes.Â
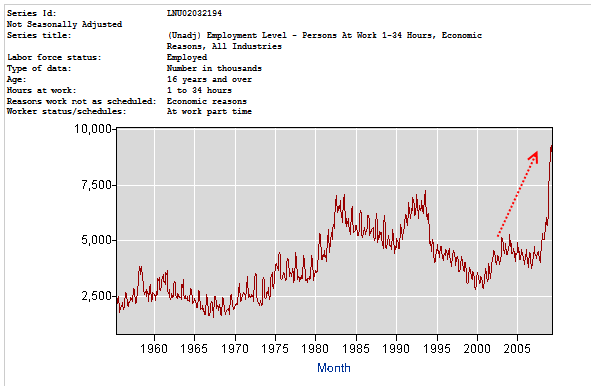
The amount of people working part-time jobs for economic reasons is off the charts:
With 9.1 million people falling into this category, our nation is quickly buffering this current recession with part-time work. The official number of unemployed is 14.5 million so the part-time number is inching closer to the actual number of unemployed. However, last month the part-time number stalled while the actual unemployment rate jumped. So what this tells us is even at the part-time level, some companies are pulling back.Â
It is hard to project where things will go from here. With so many stimulus programs at work, it is hard to say how this will translate but the bottom line is when it comes to employment, there are no green shoots. The aggregate hours worked figure is probably one of those indicators that you want to follow closely because it will be a more accurate leading indicator of when the employment situation will change for those on main street.
The U-6 rate is now up to 16.4 percent. Back in December I made the assessment that we will feel a mini-depression once the U-6 hit the 19 percent mark. We are inching closer to that. At the time, the U-3 rate was at 6.7% and the U-6 rate was at 12.5%. And just to show how close these two track, this is how much they have increased since then:
6.7% then – 9.4% now =Â Â Â Â Change of 40%
12.5% then – 16.4% now =Â Change of 31%
The reason as we mentioned with part-time not hiring, is a reason why the U-6 has fallen. But at this rate, U-6 will be at 20 percent by the end of 2009. The U-3 rate will be in double-digits certainly by the end of the year (probably the end of the summer).  Â
If you enjoyed this post click here to subscribe to a complete feed and stay up to date with today’s challenging market!2 Comments on this post
Trackbacks
-
Koko said:
Many people I talk to feel this economic down turn is behind us, I wonder when the rubber will meet the road in the minds of the masses that we are in this for a while. 6 months ago it was cool to talk about how you are saving now we are all back out spending like our problems are solved. I worry about our future.
June 16th, 2009 at 6:41 am -
CD Rates Guy said:
Great post! Finally someone who’s willing to acknowledge the true unemployment crisis facing this country.
June 17th, 2009 at 2:52 pm


