24 Million Americans Unemployed or Working Part-time but Available for Full-time Work. Why This Recession Feels Much Worse to Average Americans.
- 1 Comment
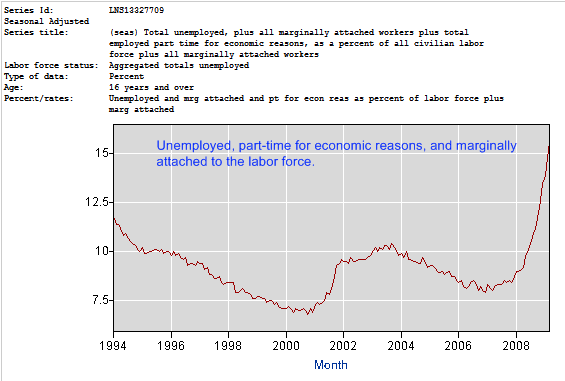
During the height of the Great Depression in 1933 with unemployment hitting its peak, 13 million Americans found themselves out of a job. This translated to 1 out of every 4 workers in the civilian labor force. You may be wondering how is it that we have recently heard rumblings that this recession may have bad elements similar to the Great Depression? After all, the current headline unemployment rate is only 8.5 percent. The truth of the matter is the unemployment situation is much worse. If we add up all the unemployed, those working part-time but are looking for full-time work, and those who have given up looking for work we would find that over 24 million Americans are out of work or under employed. 25 out of every 100 workers during the Great Depression. Currently 15 out of every 100 workers in our current recession.
First, let us break down the numbers:
Civilian Labor Force:Â Â Â Â Â Â Â Â Â Â Â Â Â Â Â Â Â Â Â Â Â 154,048,000
Unemployed:Â Â Â Â Â Â Â Â Â Â Â Â Â Â Â Â Â Â Â Â Â Â Â Â Â Â Â Â Â Â Â Â Â Â Â Â Â 13,161,000
Part-time for economic reasons:Â Â Â Â Â Â Â Â Â Â 9,000,000
Marginally attached to labor force:Â Â Â Â Â 2,100,000
Total unemployed, part-time, and marginally attached:Â Â Â Â Â Â Â Â 24,261,000
Unemployment rate using above metrics:Â Â Â Â Â Â Â Â Â Â Â Â Â 15.7 percent
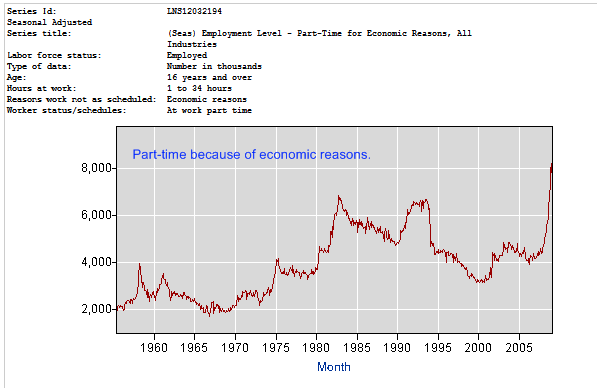
Now much of this divergence is because of the enormous jump in those classified as part-time due to economic reasons. This category has been exploding over the decades. Let us look at a chart highlighting this shift in the American employment world:
What is hard to examine here is the range of those working part-time can be anywhere from 1 to 34 hours. Most of these people will not qualify for typical benefits such as healthcare coverage which only makes the recession that much tougher for them and also adds to the jump in bankruptcies we have been seeing. And it is hard to tell how the hours break down since we do not have that data. Where is the average? For example, if you are working a contract position for 10 hours a week, this is very different from working 34 hours a week at a factory. However, the fact of the matter is that we are in record territory regarding part-time employment. And this is a key fact now being picked up by more media outlets probably because many in the media are part of that contract labor force with no employment protection. In Japan for example during their lost decade, unemployment stayed relatively low hovering around 5 percent yet if you cut through the data, you will find that nearly one-third of the Japanese population in employed on a part-time basis. Looking at this chart it looks like we are heading that way.
There are now more officially unemployed Americans than at the height of the Great Depression. And we are only looking at the official number of 13 million here. Of course our population is much larger yet this is not a statistic we want to be breaking here.
We have covered the 13 million officially unemployed, the 9 million part-time workers, and now we need to look at the 2.1 million who are marginally attached to the labor force. What does this mean? These are individuals who want and are available to work but had not looked in the previous 12 months. There were 685,000 of these people. Yet the other troubling figure is the 1.4 million that are now considered marginally attached and have not looked for work in the past 4 weeks because of school or family responsibilities. This number is growing larger and larger. Although it is good many are going back to school, one would have to ask for what industries since looking at these numbers, you have 4 workers looking for each 1 full-time job available.
If we add these measures together, we will find that our current unemployment situation is already worse than that of the early 1980s:
Just as a reference point, at the height of the early 1980s recession, there were 11.5 million Americans unemployed and 6.8 million classified as part-time for economic reasons. As we know, unemployment is a lagging indicator and we view recent estimates of 10 percent headline unemployment coming down the line. We will also need to look at these other areas to get a better picture of the employment situation.
If you enjoyed this post click here to subscribe to a complete feed and stay up to date with today’s challenging market!1 Comments on this post
Trackbacks
-
Jeff said:
It doesn’t help that those folks aren’t even counted in the unemployment numbers.
The “signal” that should be forcing both business, citizens and the government to react and react sooner has been eliminated or diminished by having the definition changed for political cover and the result is that things have to get worse than they did in the Great Depression just to trigger the same level of response.
The worse problem is that it’s “path dependent” and things can go “too far” or get “too big” for a given now mis-proportionate response to even have an effect. That’s the fundamental and deadly flaw with politically motivated changes away from “reality-based” statistics.
You can find statistics equivalent to these politically damaged statistics at shadowstats.com They also have the unemployment, GDP, CPI & M3 re-synthesized. It’s completely obvious that if these statistical definitions had been either left alone entirely or if the old and new versions were continually published we would have see our current troubles coming at least a decade earlier. All the signs of trouble were there!
http://www.shadowstats.com/alternate_data
Things like M3 money supply “mysteriously” disappeared from official government reports several years before the actual real estate crash occurred. Pretty much proof that key people in government knew exactly what was coming and chose not to do anything.
The government is most certainly not here to help us.
April 5th, 2009 at 6:33 pm


 If you enjoyed this post click here to subscribe to a complete feed and stay up to date with today’s challenging market!