Bear Market Rallies: Beware the Siren Call of Volatile Economic Markets.
- 2 Comment
It is understandable after the record fall of the Dow Jones Industrial Average from a peak of slightly over 14,000 in August of 2007 to a low reached last month of slightly over 8,000 that many are eager to search for a bottom. It is a tempting path to follow especially when the market is down 36% from those highs. There needs to be a cautious attitude about jumping into a market when future news is almost certain to be challenging for the economy. The October jobs report now puts us at an unemployment rate not seen in over a decade and for 2008, we have lost over 1 million jobs.
It is hard to shake off the notion that one should not jump into the market right now with both hands full of cash. Even solid companies have been hit hard and appear to be undervalued. Appear being the operative word here. Yet we need to remember that companies, even the solid in the group are projecting dismal future earnings which will only depress their prices.
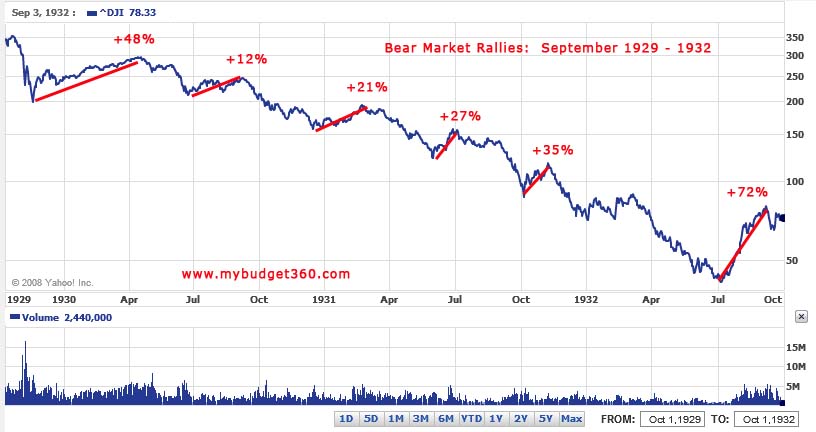
In this article we will look at the incredible bear market rallies during the Great Depression and try to offer a cautionary approach for the near term investor. Let us first take a look at a chart from October 1, 1929 to October 1, 1932:
Click for a clearer picture
What you’ll notice that even after the great crash there were epic rallies during this time. Let us recap the above rallies below:
November 1929 – April 1930:Â Â Â Â Â Â Â Â Â +48%
June 1930 – September 1930:Â Â Â Â Â Â Â Â Â +12%
December 1930 – February 1931:Â Â +21%
May 1931 – June 1931:Â Â Â Â Â Â Â Â Â Â Â Â Â Â Â Â Â Â Â Â +27%
October 1932 – November 1931:Â Â Â Â +35%
July 1932 – September 1932:Â Â Â Â Â Â Â Â Â Â +72%
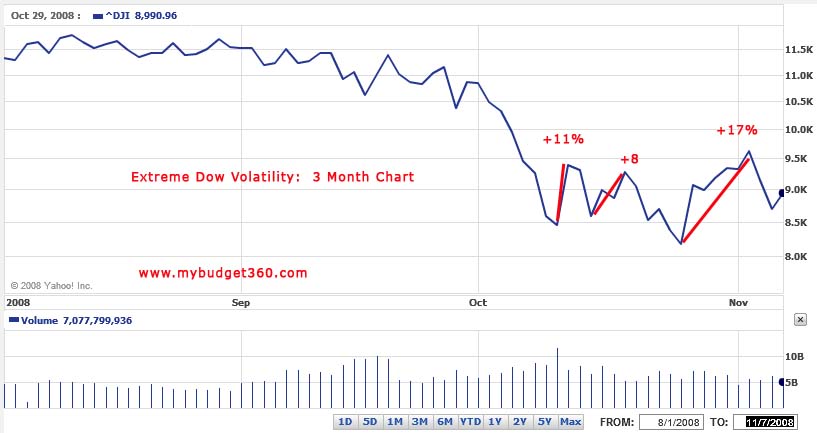
Take a look at the those significant rallies within the Great Depression Dow market. Keep in mind the longer-term trend from the high in September of 1929 (380) to low in July of 1932 (41) represented a 90 percent decline in value. That is why heavy market volatility is a symptom of a market in utter distress and not a healthy signal to purchase. We need only look at the Dow for the last 3 months and we’ll see some disturbing similarities starting to emerge:
In the last few months, we have seen a rally of 11%, 8%, and a whopping 17% in a matter of a few days. These are normally gains that are reserved for one good year on the Dow. Think that isn’t true? Let us look at the Dow performance for this decade:
2000:Â Â -6.2%
2001:Â Â -7.1%
2002:Â Â -16.7%
2003:Â Â +25.3%
2004:Â Â +3.1%
2005:Â Â -0.6%
2006:Â Â +16.3%
2007:Â Â +6.4%
2008:Â Â -32.57% (year to date performance)
That 17% run up we just had in a matter of days is larger than some of the yearly returns.  These up and down motions simply reflect a market that is utterly in disarray and trying to find some semblance of a bottom. Those jumping into the market today may have a run like the previous bear market rallies we have just witnessed but make no mistake the longer trend is going lower. Why? A few reasons:
(1) Employment is weak and will continue to be weak. As I discussed in a previous article peak unemployment normally hits 2 years after a recession start date which puts us at peak unemployment in 2010.
(2) Earnings will continue to suffer. The current dividend yield for the Dow remains extremely low at 3.7%. This clearly has the market overvalued for the extent of volatility inherent in it. The average yield of previous bear market bottoms is 6.7% to compensate for the added market risk. The yield hit 16% in 1933 during the bottom of the Great Depression which should give you an idea of where we stand. If this is as bad as then it is quite possible to see yields this high.
However, even if yields were to be at a moderate 6.7% the Dow would need to fall to approximately 5,000 and that is the yield we saw in the early 1980 and early 1990 recessions.
(3) Consumer psychology of diversification. In major bear markets like the one we are currently in, being diversified is actually a poor strategy. The only way to stay safe is to be in cash. Let us take a look at a few investments and see how they have done for the year:
2008:Â Year to date
Dow:Â Â Â Â Â Â Â Â Â Â Â Â Â -32.57%
NASDAQ:Â Â Â Â Â -37.89%
S & P 500:Â Â Â Â Â Â -36.6%
Gold (ounce):Â Â -12.2%

Oil:Â Â Â Â Â Â Â Â Â Â Â Â Â Â Â Â Â -37%

Â
Nikkei:Â Â Â Â Â Â Â Â Â Â Â Â -40%
FTSE:Â Â Â Â Â Â Â Â Â Â Â Â Â -31%
Hang Seng:Â Â Â Â -48%
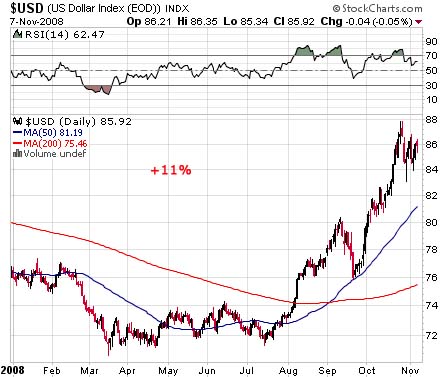
We can go on and on but this is simply a reflection of the global nature of this market crisis. The only bright spot incredibly was the United States Dollar:

The U.S. Dollar Index is up 11% for the year. This is primarily because of the massive de-leveraging going on around the world and also the fact that all economies are entering into major recession. There was for a time an idea that many countries would be fine even if the U.S. had internal problems. That is clearly not the case.
Conclusion
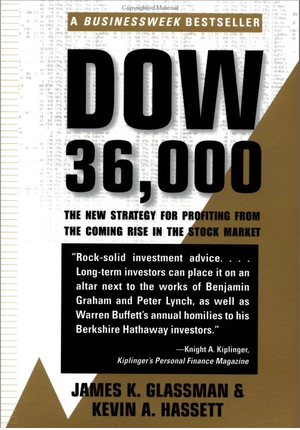
As tempting as it may be to jump back in the market, history tells us that there will be more continued market volatility and the likelihood of the market trending lower is very high. Even experts get things horribly wrong. Let us take a look at the now infamous book that was published in 1999 to serve as a sturdy reminder:

If we look at year to date performance of various sectors, it would seem that going with cash is not exactly a bad strategy. It is definitely not recommended to go all in to stocks regardless of what many experts are saying. We had a consumer confidence report that was at 41 year lows. Be careful with that siren call because this is going to be one of the toughest recessions we’ve had in a very long time.
Â
If you enjoyed this post click here to subscribe to a complete feed and stay up to date with today’s challenging market!2 Comments on this post
Trackbacks
-
Cash? said:
Well, cash for now. What about when the dollar pile falls on us? What then?
November 10th, 2008 at 1:28 pm -
normun lamont said:
see web
Jp Nikkei, DJI were once both 1,000
Russell “Dji and price of gold will again be similar at…
about fourthousand.”November 16th, 2008 at 6:03 pm


 If you enjoyed this post click here to subscribe to a complete feed and stay up to date with today’s challenging market!