The standard wage for an American is $29,000: Social Security data reveals raw figures for the wealthiest country in the world.
- 4 Comment
All Americans pay Social Security taxes. So looking at Social Security for income data is fairly reliable. The new Social Security figures show that Americans continue to make a lot less than what the public tends to believe. For example, you may have seen mainstream shows with talking heads saying that someone making $200,000 a year is somehow middle class. First, if your family is making that much you are in the top five percent of all U.S. households. Not exactly the middle. The median figure is the best measure here. This is the point where half of workers make less or more (the true middle). The latest Social Security data shows that the median worker income earned by an American is much less than what most expect.
What does the typical American worker make?
Most Americans are living by the seat of their financial pants. Half of the country is living paycheck to paycheck hoping their money clears into their account fast enough to pay the mortgage or rent and electricity. You also see so many people going into incredible levels of debt just to maintain the illusion that they are somehow middle class.
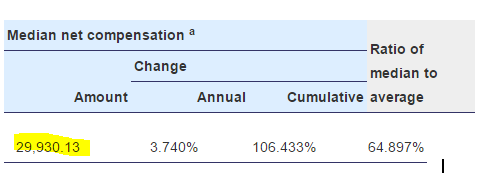
Social Security data is very reliable because this is a tax that we all pay. Here are the latest figures:
Source:Â SSA
The typical American worker is making $29,930 per year. Keep in mind that from this amount you have taxes being taken away and this also doesn’t account for other expenses like healthcare. Overall Americans are struggling to get by and many people just don’t do the research to find out what is the true income situation for most in the country. Many would rather rely on pundits and talking heads that have some underlying agenda to push.
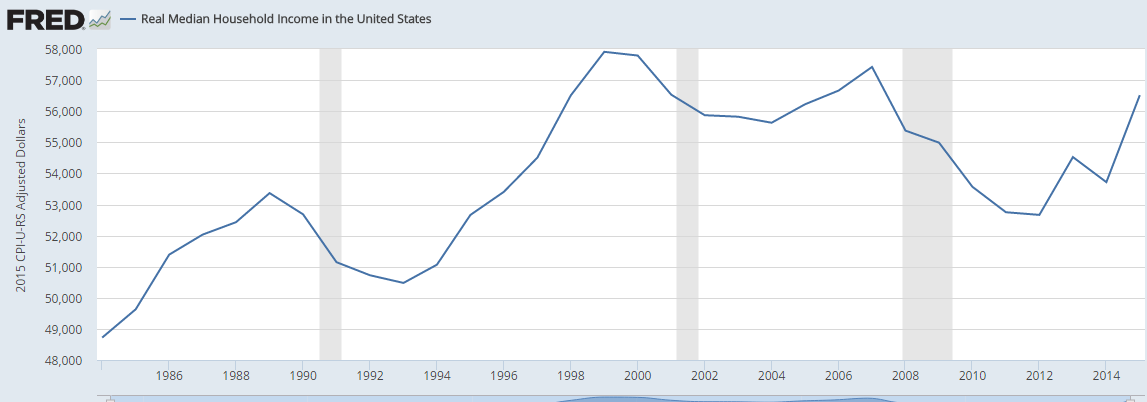
This figure should be put into context. Many private colleges now charge $50,000 or more a year in tuition. So a four year college education is going to cost many six-figures while the typical wage of an American is $29,930. Even looking at household income, the median amount is $56,000:
So Americans continue this battle to stay on the middle class bandwagon but the cost to stay on continues to get more expensive. People keep running faster and faster on the treadmill simply to stay in the same place (the Red Queen’s race dilemma).
What is also problematic here is that with America getting older, many Americans are now relying on Social Security as their primary source of retirement income. That was never the intention of Social Security. It was meant to be one leg of a three legged stool for retirement built on pensions, independent investment accounts, and Social Security. As you know, pensions are nearly extinct and the 401k has been a disaster for most Americans when you look at data. So half of elderly Americans rely on Social Security as their primary source of income.
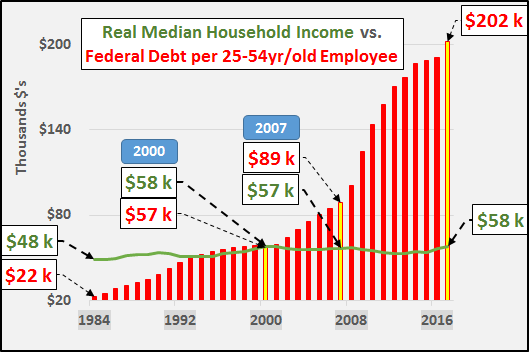
And the debt we are taking on per American worker is mind boggling:
Social Security and Medicare depend on a large young workforce that is actually earning money. By definition this trend cannot continue.
If you enjoyed this post click here to subscribe to a complete feed and stay up to date with today’s challenging market!4 Comments on this post
Trackbacks
-
andy said:
“All Americans pay Social Security taxes. So looking at Social Security for income data is fairly reliable.”
Hmmm…Not really….more correctly lower and most middle income earners pay SS tax. The higher you go in income, the more you will find they get a significant portion of their income “unearned”, from rents, royalties and investment income….because as it turns out, they aren’t STUPID…..AND they have accountants to educate them.
My own social security statement looks like I died 20 years ago because I figured out the difference between earned and unearned income (hint: it’s 15.3%)and moved most of my income to unearned.
So how much that skews your $29,000 figure is anyone’s guess, but it is certainly higher.
January 30th, 2017 at 6:18 pm -
KaD said:
The data speaks for itself- how are people supposed to have private investment accounts and pensions at jobs that pay less than $30K a year, many pay MUCH less. It just can’t be done in a normal market, moreso in one where inflation, rent, groceries and healthcare are all rising quickly.
January 31st, 2017 at 8:45 am -
CJ Schwer said:
There is considerable difference between the average wage earned, and the median wage earned. And these are not the same as the household income. Some of that household income comes from non-wage sources. Based on SSA data “about 67.2 percent of wage earners had net compensation less than or equal to the $44,569.20 raw average wage. By definition, 50 percent of wage earners had net compensation less than or equal to the median wage, which is estimated to be $28,851.21 for 2014.†And “about 67.4 percent of wage earners had net compensation less than or equal to the $46,119.78 raw average wage. By definition, 50 percent of wage earners had net compensation less than or equal to the median wage, which is estimated to be $29,930.13 for 2015.” A 3.74% increase in paid wage earnings of medium wage earner.
The source of the numbers, [ https://www.ssa.gov/OACT/COLA/awidevelop.html ; then you must click “Go” to see the numbers. Data for 2016 will be available in mid October 2017. ] will not explain this. For the math challenged, this will be difficult to realize. The $55,775 is the national median HOUSEHOLD income. So there are those people who own business that have incomes that does not come from their paid income.
The following are some of the numbers that really stood out for me…
-38 percent of all American workers made less than $20,000 last year.
-51 percent of all American workers made less than $30,000 last year.
-62 percent of all American workers made less than $40,000 last year.
-71 percent of all American workers made less than $50,000 last year.January 31st, 2017 at 9:44 pm -
CJ Schwer said:
My above comment, earned income is the income of an individual, the household income is the income of the family and that also explains the difference between household income and earned wages.
January 31st, 2017 at 9:48 pm


 If you enjoyed this post click here to subscribe to a complete feed and stay up to date with today’s challenging market! Â