Comparing the inflated cost of living today from 1938 to 2013: How the US Dollar has lost incredible purchasing power since 1938.
- 21 Comment
Money is only as useful as to what it can purchase. The Fed has created a system where debt is now equal to money. This is why big purchases like cars, housing, and even going to college are only feasible by mortgaging your future for many decades. Since the payments are broken down into tiny monthly installments many people pay little attention to the true cost of things over their lifetime. Yet over this time, the U.S. dollar has lost a tremendous amount of purchasing power due to inflation. Inflation slowly eats away at your purchasing power yet having access to debt has given the middle class the false impression that they are still protected from the unraveling impacts of inflation. Someone sent over a photo posted over on the popular Reddit website that shows the cost of living for people back in 1938. You would think that people in 2013 would have more purchasing power than those living through the Great Depression. Adjusting for inflation you would be surprised what has happened in the last 75 years.
The cost of living between 1938 and 2013
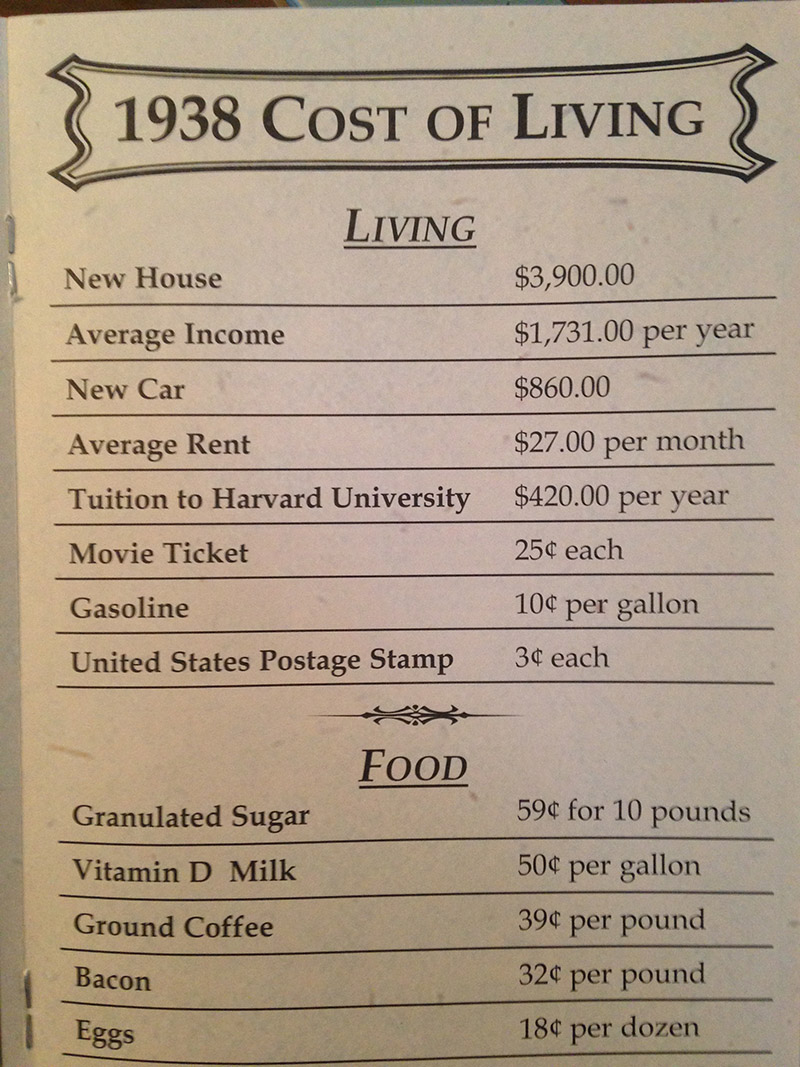
The picture in question has prices for living from 1938. It includes important items like a new home, income, new car, rent, and extreme purchasing examples like tuition for Harvard:
Source: Â Reddit
You can normalize costs over time through adjusting for inflation. Back in 1938 a new home cost about two times the annual average income. A new car was only about one-third the cost of the annual average income. These figures are important because back in 1938, using credit was only a small factor in purchasing goods. The middle class didn’t start blossoming until after World War II so you would expect that things were still tough for regular households. What we find though is that compared to the typical income, buying a new home or buying a car was relatively doable for most households.
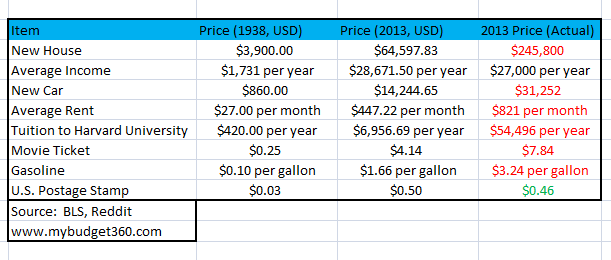
Now adjusting all these figures for inflation shows how much more expensive things have become and how dependent we now are to financing purchases with debt (created by the banking system):
This chart shows the impact of inflation and the declining purchasing power of the US dollar. For example, a new home adjusting for inflation (using the BLS calculator) should cost around $64,597 per year. The current cost of a new home? $245,800. The average income has stayed about the same normalizing for inflation (doesn’t say much since we are going back to the Great Depression here). A new home today costs nearly 10 times the annual average income of a worker. The two income trap has largely hidden this inflation since it now takes two households to accomplish what one income was able to do 75 years ago. On top of that, people now need to go into massive debt just to purchase a home. Â
Take a look at the cost of a new car as well. In 1938 a worker was able to purchase a new car with one-third of their annual income. Today a new car is more expensive than the annual average income. This is why in 2013 one of the top growing consumer debt sectors was with automobile loans. If things stayed the same, the cost of attending Harvard for one year in 2013 would be closer to $7,000 per year (the current tuition is $54,496 per year). It isn’t only Harvard charging incredibly high tuition around the country. Of course the higher education bubble is one of the most pressing issues around creating a $1.2 trillion student debt market. Â
Rent, movie tickets, and even gasoline are much more expensive today adjusting for inflation. This puts a heavier strain on the pocketbook of most Americans. It also has created a dependency on debt. We do have stronger safety nets so we don’t have the “in your face†poverty of the Great Depression. Yet we still have close to 48 million Americans on food stamps. The area that has seen prices become more affordable is with food. This however is largely derived from better access to food and products and the mass production of this commodity. Yet the bigger costs of living in housing, cars, rent, and going to college are all much more expensive today. It may feel cheaper to some if they only look at their monthly debt payment but the true costs have increased.
The impact of a falling dollar
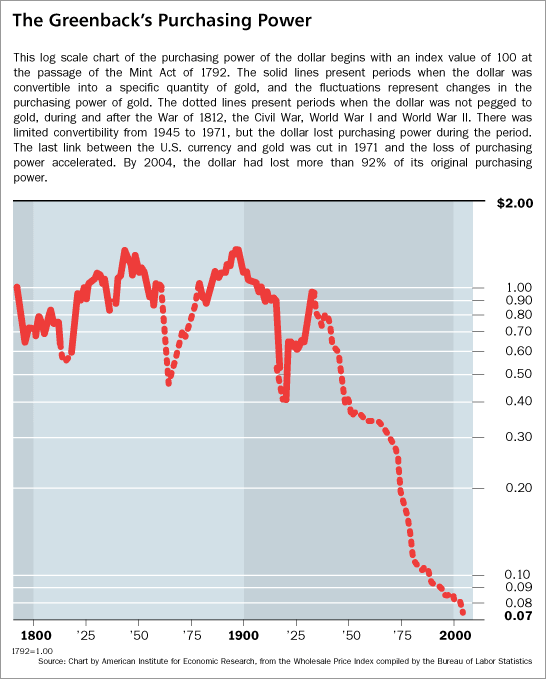
The trend of the US dollar is pretty clear since the Federal Reserve took the helm of the ship:
Without a doubt, life has gotten better since 1938 in terms of healthcare, technology, cars, sanitation, and overall quality of life. Yet this may be a false comparison argument assuming that this only came about because of the Fed. Quality of life had already started improving before this as well via the Industrial Revolution and these things were happening regardless of the money system. What this current debt based system has created is a massive increase in the price of goods through long-term financing. Should people only have the ability to go to college if they assume mountains of debt? For the average worker this may be the only road.
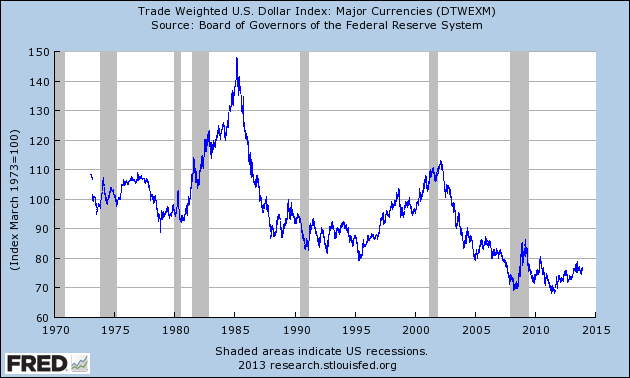
The US dollar even in the past few decades has taken a big hit:
Why does it feel like things are more expensive? Because they are. You may not feel the impact of inflation in one year but over time, it has a dramatic and obvious effect. The fact that the Fed now has $4 trillion on their balance sheet and continues this QE experiment reflects an addiction to easy debt. The addiction now truly benefits a very small segment of our society and that is why inequality is worse today than it was in 1938. It should tell you something where regular purchases from 1938 are now only feasible by going into massive debt.
If you enjoyed this post click here to subscribe to a complete feed and stay up to date with today’s challenging market!
21 Comments on this post
Trackbacks
-
roddy6667 said:
I think back to my first apartment in 1968 when I was 20.
Rent $70
Gallon heating oil $.18
Decent blue collar wage $3.50
Gasoline $.28
Pound of chicken $.29
Pack of Marlboros $.65December 22nd, 2013 at 11:49 pm -
Jerry said:
Wait a minute!!!
What about the 800 pound gorilla in the room?
State, Federal and social security taxes!
That cuts your current income in half relative to how much you can actually USE for the above.
December 23rd, 2013 at 2:45 am -
Hey You said:
What is inflation? Could it be government manipulation of the currency?
December 25th, 2013 at 11:13 pm -
Johnathan Reynolds said:
Why do we accept inflation as “normal?” It is abnormal and should be stopped for the very reasons you have listed above.
What causes inflation? Simply – a spiritual subnormality – GREED –
Here is the grocery store with bread at $1 per loaf. The corporation decides to raise the price to $1.10. This impacts the poor people so that the standard of living drops. Cui Bono? The rich people. It is easy to conclude that inflation is a tool used by rich people to keep poor people poor.Sometimes I wonder what happened to, “Love ye one another as I have loved you.” Maybe He was making a joke and didn’t really mean it.
December 27th, 2013 at 10:01 pm -
Deanna Johnston Clark said:
I remember when a husband driving a delivery truck could buy a small home for his family. The wife might work after the children got older, or not.
There was time for church, for fishing, for playing cards with friends, for day trips, for looking out the window with a cup of coffee and doing a crossword puzzle. The American peak year for happiness was 1957…this is factually verified.
After that came a barrage of bull, books, lies, and propaganda…to jack up real estate prices and tax revenue.
My grandparents paid for everything with cash…common for people in the early 20th century. There was pride and a sense of right or wrong with money. And there was time…beautiful TIME for living.January 4th, 2014 at 2:25 pm -
Chris said:
I lot of inflation has been shifted to food packaging. Boxes of cereal get thinner, bags of chips get less in them, candy bars continue to shrink, If milk was not subsidized, the price would be dramatically higher. Frozen meals have shrunk in size. Some chains like Costco are not afraid to raise prices on staples their customers like if the underlying commodity has become more expensive.
January 4th, 2014 at 7:02 pm -
Robert J Schundler said:
We should look at the Basic Law of economics in the relationship of the amount of money (demand) to the supply. Since we now have two incomes plus government loans to finace what we want. Two people wanting to live in the same home with twice the income plus fanny mae would drive the prices of home up, also the cost of college has been affected by the government student loan program all of which drive up the price. Get the government out of the finance business, and we would have lower prices on many items.
April 15th, 2015 at 5:35 am -
Eric said:
Alright, so I agree with the whole premise of this article. However, there are a few grievous math errors that makes me question the validity of all of the stats :
The cost of an average new car in 1938 was HALF the yearly income (860 vs 1731).
Next, the use of the word “average”, for which you most likely meant MEAN. The mean income for a US worker in 2013 was just under 27k.However, I agree fully that the inflation numbers fail to take into account the fallacy of the multi-worker homes. The mean household income in 2013 was ~57k, meaning the average household could still spend half its income in a year to purchase a new vehicle.
July 1st, 2015 at 2:26 pm -
Ryan said:
the definition of mean, in case eric was confused:
“Average is a synonym for arithmetic mean – which is the value obtained by dividing the sum of a set of quantities by the number of quantities in the set. An example is (3 + 4 + 5) ÷ 3 = 4. The average or mean is 4. Two other common forms of averages are the median and mode.”
September 30th, 2015 at 10:16 pm -
Conrad said:
No money is ever created until it is borrowed. Otherwise it is just changing hands. This mountain of debt is very much intentional.
In as much as the stark contrast between adjusted inflation and actual yearly Harvard college tuition. One could argue that the student body is much higher so therefore, costs must go up. What? No one else thinks that is insanity? Apparently we like, or choose to work against each other. Many of our products today are “throw aways” not repairable due to the cost replacing is generally cheaper than fixing. Competition said “I can make it cheaper” Now I have a variety of 30 different blenders to choose from that does not crush ice. Could I just have one that works? Or a tool that does the job as intended to? 30 day warranty 60 day warranty? Huh? I’m not trying to blur the lines of Socialism or Democracy, or even as a Progressive. But I do believe in working together for good. The cost of homes, schooling, transportation, (car, bus, train, plane) food, water, medical, clothing, general merchandise, or necessary household items, heat and electricity, should all have been very affordable had we worked together. When everyone competes, everyone looses.
Most of our inflated dollars, are sitting in corporate banks and vaults not being spent because the wealthy are not in need of anything, monetarily speaking. Which decreases our GDP. Were some of those dollars in the hands of the middle to lower classes, our GDP would have fared much better as those dollars would have been traded to try and meet the cost of living.
We have a mountain of debt, they must, to create dollars one must borrow. We have been enslaved to serve in this system. Everything is a bubble, this financial system is very fragile. When we the consumer can no longer afford to buy your goods and services… game over. We all loose.December 10th, 2015 at 12:04 am -
veronica smith said:
Thanks for the information on this website .It is very useful because we are doing a comparision of then and now
April 12th, 2016 at 6:07 am -
Edward said:
First I agree that things are not getting easier, and love this site.
The Average income is $50k now (not median),
1938 income: 29 x $1731= $50,200 (about average income now.)1938 home: $3900 x 29: $113,000, I can find an ok home for that money here in RI. Would probably be smart to start looking.
Car: $860 x 29: $24,940 (Price of great mid-sized family car)
Rent: $27 X 29: $783, I pay $775 for a nice 2 bed room
Tuition Harvard: $420 x 29: $12,128, RI College is $8,000/year
Eggs: .18 x 29: $5.22 = Nice organic eggs
Milk: .5$ x 29 = $14.90 (save a lot here)
Gas: .1 x 29 = $2.90 (pay around $2.30 a gallon now)Me and my wife can live on just one income of $50k in RI, which is about $2800/month after taxes.
Rent 775
Phones 150
Internet 65
Insurance(car) 150
Electric 70
Gas 100
Food 700
Maintanance 200 (purchase/drive used cars)
Clothes, Misc 200
Petrol 210 (15k miles per year (x2 cars), 27mpg, $2.25/gallon)
Total Expsense 2620
Health Care: Included in payWe can still save $200, if we both make $50k, we can save about $30,000 per year, We could buy a home in about 4 years at that rate (in RI).
June 19th, 2016 at 10:27 pm -
Rusty said:
Can you please include your source for the average income in 2013?
As I read down this page and the comments I was pleasantly surprised by the last comment by Edward. He ran the same experiment as I. Therefore I am perplexed by the analysis presented in this article. I can’t seem to find any sources that list the average income in 2013 to be $27,000 as you show in your analysis. According to the U.S. Department of commerce, the median household income in 2013 was $52,250 (http://www.census.gov/content/dam/Census/library/publications/2014/acs/acsbr13-02.pdf). Given that information it would appear that the buying power of a dollar is relatively equal to what it was in 1938.
July 19th, 2016 at 5:18 pm -
Rusty said:
Rusty, again.
After browsing your site a bit, I was able find where the average income figure you use comes from.
https://www.ssa.gov/cgi-bin/netcomp.cgi?year=2011 just in case any other casual readers are curious.
In my defense, as someone who stumbled upon this article through a google search in trying to find the average income from a government source, I was initially irritated that the article made such a claim without any backing. However I did find a source for the statistic in another article on the site so I do apologize.
July 19th, 2016 at 6:13 pm -
Mike said:
To address Rusty’s question about the mean income. I will use an example.
10 people make a total of $100. The average income is $10.
What if 1 person makes $91? That leaves $9 for the other 9 people. Average income is still $10.
So when Edward says he makes 50k, and that’s the average income… That’s a little misleading. The actual weighted average, median, means the same number or people above and below.
Both figures are thrown off by the super rich.
50% of our population makes less than 27k, 50% makes more than 27k.
Random fun fact. As of 2010, the top 5% of income earners made $6.6 trillion the other 95% of our population made $5.8 trillion.
October 18th, 2016 at 5:34 pm -
James Grierson said:
I’m confused, How could the average yearly income in 1938 be $1,731.00 if the minimum wage was only .25 cent an hour, If this publication is true it means the average person was making $4.50 an hour and we didn’t make that much an hour until the 1990’s and I made a Minimum wage of $2.65 an hour when I started working in the 1970’s,
Where did they get their information from and how reliable is it.
My great-grandmother when working in the 1930’s I was told only made $10.00 a week working for bell-south or Ma’bell as an Operator so I believe this information to be incorrect.I got my information on minimum wages from the department of labor’s website and from those who lived in that time period.
November 14th, 2016 at 11:45 am -
James Grierson said:
Or maybe I read it wrong.
November 14th, 2016 at 11:49 am -
Brandon said:
James, how did you calculate $4.50? $1731/$4.50 is 384 work-hours, which is about two and a half full-time months.
$1731 a year / (50 weeks * 40 hours) = $0.86/hour.
Interestingly, $0.86/$0.25 ~= 3.4, which is also the average/minimum wage ratio in the US presently.
February 12th, 2017 at 12:41 pm -
carroll price said:
Inflation is calculated theft, with the thief being none other than the Federal Reserve bank.
October 15th, 2017 at 1:02 pm -
natsfan11 said:
Remember when a family of 4 could be supported by 1 earner (1944-1975). The effects of massive social welfare costs and very high immigration rates since 1965 may have greatly contributed to a lower standard of living. This would be an interesting future research project.
February 22nd, 2019 at 8:06 am -
Joe M said:
Come on, let’s compare apples to apples. A 1938 home had an average of 233 square feet – the size of a kitchen or living room today. Have you ever been in a middle class home built in the 1930’s that hasn’t been remodeled? It’s TINY. Whole families lived in those homes. The cost works out to $16.47 per square foot. A home in 2017 has an average square footage of 2,371, nearly ten times higher. How much has income gone up in that time period? 27 times. Comparing the same home cost today in real dollars it’s significantly less than 1938 per square foot. And today’s homes have so many more conveniences, like washing machines and dishwashers. You can do the same comparison with cars. You can’t buy a car in 2019 that has the same minimal features of a 1938 car. But if you do the math of how many hours it cost in 1938 to buy a car (1,034 hours) to today (1,560 hours), and considering the car you’re getting today compared to then, it’s a much better deal. The article also omits how much the prices of food have gone DOWN. The only calculation that matters is the number of hours for the average worker to buy a particular thing. The math shows that it takes 10% fewer hours for a gallon of gas, 44% less for a postage stamp, 61% less for sugar, -39% for milk, a whopping 88% less for a pound of coffee, -44% for bacon and -65% for eggs. Things have gotten better, not worse. Email me and I’ll send you my spreadsheet with links.
October 11th, 2019 at 9:24 am


 If you enjoyed this post click here to subscribe to a complete feed and stay up to date with today’s challenging market!