Credit Nation: The Back Breaking Debt Problem in the United States.
- 1 Comment
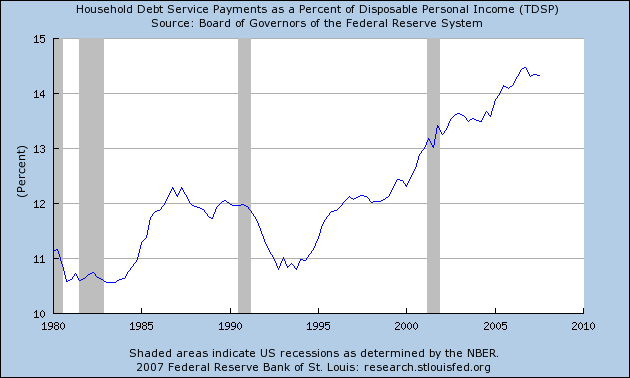
Let us take a look at a very important chart, household debt service as a percent of disposable income:
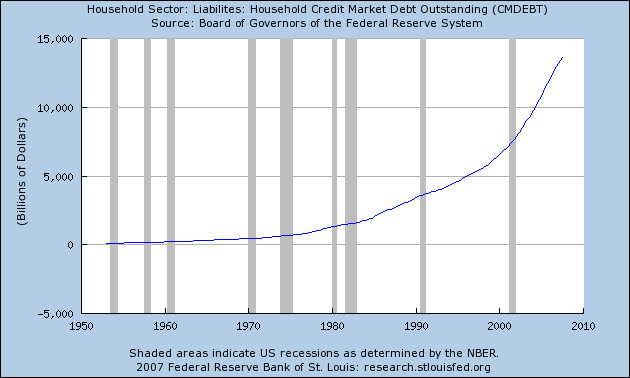
As you can see from the above chart we have been on a steady upsurge since the 1980s. Even during the technology bubble and the current housing bubble average households didn’t feel richer because more and more of their money went to service their debt obligations. At this point we have reached a plateau of nearly 14.5 percent of disposable income used to service debt. In the early 90s we tried a bit to scale back but it is extremely hard to resist plunking down all your money on AOL stock options. Let us look at another chart that takes a look at household credit market debt outstanding:
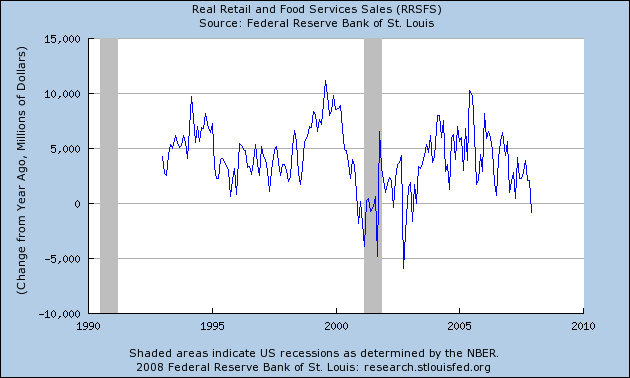
Currently there is an amazing $13.64 trillion in debt outstanding. As we mentioned with the $20 trillion in residential wealth, a 20 percent decline will wipe out $4 trillion in wealth while the debt outstanding does not change. What we are seeing is a convergence of equity plowing into reserve wealth. When this occurs you see a negative wealth effect and a retrenchment in consumer spending. If you are wondering why the government is so eager to send us checks in the mail this is why. The
The above chart shows retail sales year over year changes. As you can see, the last time we went year over year negative was after our 2001 recession. If we aren’t technically in a recession, we’ll soon be in one and this one is looking more like the early 1980s recession. Time to cut up those high interest credit cards.
 If you enjoyed this post click here to subscribe to a complete feed and stay up to date with today’s challenging market!
If you enjoyed this post click here to subscribe to a complete feed and stay up to date with today’s challenging market!


[…] […]