Deleveraging on good debt and ramping up on consumption debt – growth in auto loan debt, collection amounts, and revolving debt.
- 0 Comments
The grand US household deleveraging event continues as debt is paid off or more likely, wiped away via foreclosures and bankruptcies. What is hidden in the deleveraging trend is the growth of debt in certain spending categories. Keep in mind that not all debt is bad. For multiple decades the US had a cautious lending apparatus in housing with sizeable down payment requirements. With this came stable home prices and real equity build up for homeowners. However, in the 2000s the housing market was transformed into a casino and subsequently popped. The reason the deleveraging is still occurring is you have many households seeing mortgage debt wiped off the balance sheet and many paying it down. By far this is the biggest debt carried. However, we are seeing some segments like student debt explode and also revolving debt and auto loans picking back up. Deleveraging might be occurring in mortgage debt but re-leveraging in other forms of debt is also occurring.
Winding debt down
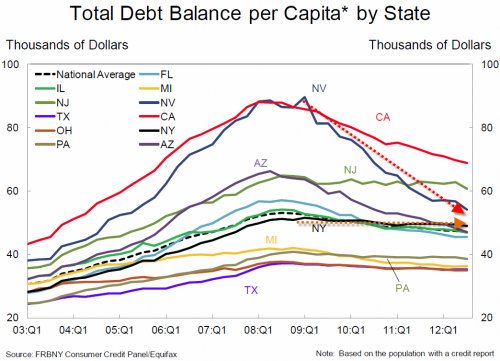
It is pretty clear from the new data released from the Fed that aggregate household debt balances are going down across the country:

Yet this goes back to our previous point. What states have seen the biggest per capita decline? Nevada, California, and Arizona. These states all saw the biggest bubbles courtesy of the housing bubble. This is why if you look at Texas for example, the debt per capita has barely moved.
This also ties in with the millions of foreclosures that have occurred. This has been the fastest way to deleverage households but clearly no one is going to argue that putting people on the streets is somehow a sign of positive economic growth.
Auto loans
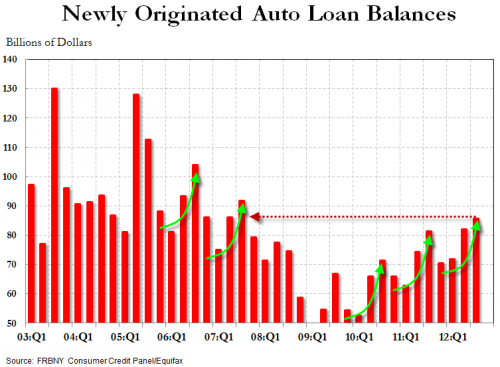
Taking on an auto loan to purchase a car, a depreciating asset once it goes off the lot is not exactly a smart financial move. Yet we are seeing people diving back in purchasing cars with debt:
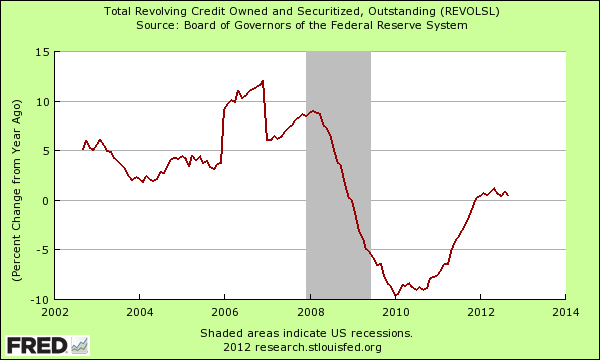
At least with a home bought at a modest price, you are building equity and are living in an asset. Cars lose value immediately. So this kind of debt growth is not necessarily positive but it doesn’t show up in the overall figures because of the massive write-downs in mortgage debt. Revolving debt is also expanding:
In other words people are back to spending money they don’t have. Blowing money on trinkets and other items is not exactly a sign of prosperity. It would be one thing if much of the items were being paid with growing wages and savings but that is not the case. Household incomes are back to levels last seen in the 1990s. So this spending, as clearly shown in the charts, is coming from a ramping up of debt once again.
Collections
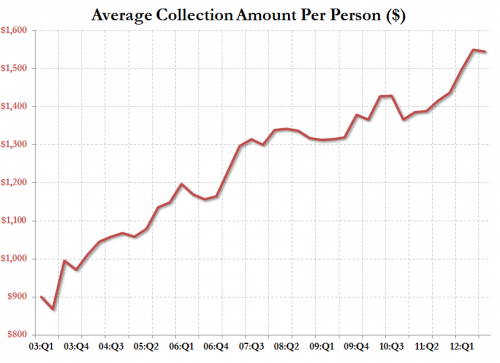
To also highlight that too much debt is still in the system just take a look at the average collection amount per person:
People can be easily convinced that because the overall per capita debt per household is going down that all is well. To the contrary, much of this is being pushed by foreclosures and is hiding the massively expanding student debt bubble. Rinse in repeat in the land of debt bubbles.
If you enjoyed this post click here to subscribe to a complete feed and stay up to date with today’s challenging market!


 If you enjoyed this post click here to subscribe to a complete feed and stay up to date with today’s challenging market!