The New American Austerity: Getting By with Less Debt and Less Money. In What Sectors are Americans Spending Less Money?
- 2 Comment
The Census Bureau reported on Wednesday that for the month of April retail sales came in at $337 billion, a decrease of 0.4 percent from the month before. The market reacted to this news and headed lower. If we pry into the data beyond the headline number, we will see that retail sales are actually down by 10.1 percent from April of 2008. Now why the market is stunned by this news should be the bigger headline since 24,700,000 Americans are unemployed or underemployed, it would logically follow that more and more Americans are having to tighten up their budgets. Many Americans are quickly realizing that austerity is now the way of life.
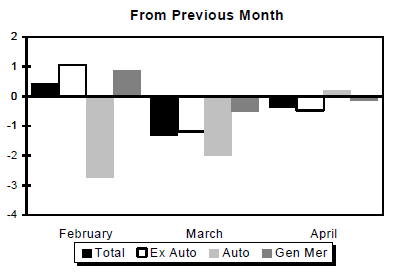
Let us take a look at the retail figures chart since two-thirds of our economy depends on retail sales:
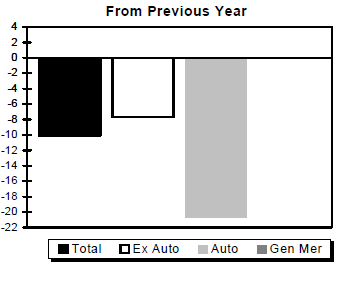
What is interesting for the month is auto sales slightly increased. Normally, the Census Bureau reports retail sales with and without auto figures. For April, auto sales actually helped the overall figure. Let us look at how retail sales measure up to April of 2008:
Taking a look over one year gives us a better sense of the overall trend. What you will see is that over one year, auto sales are down over 20 percent while retail sales are down by approximately 10 percent. These are gigantic numbers when you think about it. If our GDP is slightly over $14 trillion a year, and consumption makes up nearly 70 percent of this, a 10 and 20 percent decline is significant.
A large part of this is many Americans are finding out that their access to credit is being limited. Over the past few months credit card companies have yanked over 8 million in credit cards from the market. What is problematic about this is Americans supplemented a decade of stagnant wages with more and more consumer debt. In fact, the massive rise in debt has occurred for over 3 decades.
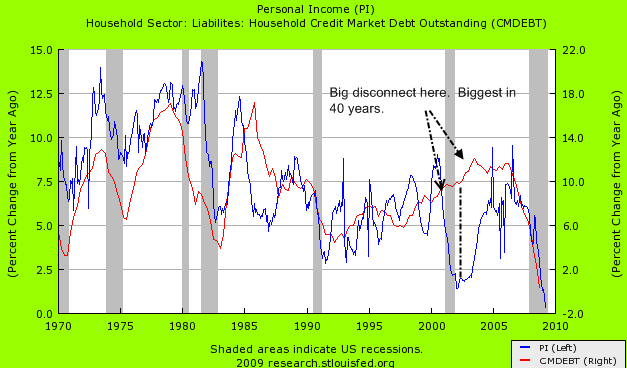
I compiled a chart that highlights this new austerity showing personal income and household debt:
This is an incredibly important chart because it strikes at the heart of the matter. If you look at the 1980s, you’ll see a big explosion in household debt; but when personal income went lower, so did the increase in debt. Over 40 years, the growth of household debt and personal income flowed in synchronization. That is, until the year 2000. At this point it is abundantly clear what occurs. While personal income started to fall on a year over year basis debt explodes. This goes on from 2000 to 2005. After muddling through, both personal income and debt are contracting at the fastest pace in over 40 years. What this tells us is the perceived health of the economy for the past decade was largely all built on a foundation of debt with no real gains for households.
The recent run up in the stock market is now hitting a wall. This market volatility that produced a near 40 percent gain in the S&P 500 over 2 months is a sign of an unstable economy, not a healthy one. What occurred is first, we had manufactured one time profits for banks because of massive bailouts and the market was starting to price in a second half recovery. After hearing that foreclosures are at all time highs and Americans aren’t spending like they once did, that second half recovery is coming into question. July 1st isn’t far away and it is hard to see what is going to occur over the next month that is going to set the American spending machine back on track.
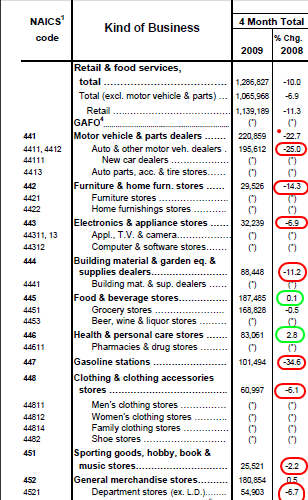
Let us examine where Americans are pulling back:
For the most part, Americans are cutting back on nearly every segment of retail goods. The only 2 areas that seem to be neutral or slightly positive are food purchases and health spending, which shouldn’t be surprising. Americans are cutting back to the necessities. One of the biggest hits is in auto sales which are down 25 percent on a year over year basis. This is a primary reason why one of the three large U.S. automakers has filed for bankruptcy and another, GM is on the verge. The disconcerting part about the U.S. automakers is that they were failing in large part to the high cost of energy. Remember that oil bubble? Well as you can see above, gasoline stations have seen a drop in retail sales by 35 percent over the year largely to the oil bubble popping. Yet you would logically think that with cheaper fuel, Americans would be back to buying big cars. That is not the case. It isn’t that people don’t want new cars, its just that they can’t afford them without easy access to credit.
Going back to the chart above, we see that electronic spending is down by 6.9 percent. That is why electronic giant Circuit City went under. People are pulling back on discretionary spending. Building material and home spending is down as well by 11.2 percent. People are finding it hard to adorn their home in HGTV fashion when money is tight. Clothing spending is down by 6.1 percent over the year. You will also see sporting goods, hobby, and book spending down. The bottom line is most Americans are shifting their spending priorities to things they need and away from things they want.
This decade saw something that we haven’t seen in nearly 100 years. Americans even with declining personal incomes were given unlimited access to credit to continue to spend. That is unheard of. The chart above demonstrates this. Right now we are facing the brunt of spending more than we were earning as a country. The chart showing personal income and household debt should tell you a lot about what occurred over the past 40 years. Debt would always increase but was closely aligned to growth or declines in personal income. This decade saw a large disconnect. We are now dealing with the recalibration of this poor alignment.
The Federal Reserve and U.S. Treasury would like to go back to the debt spending ways of the past but that isn’t in the cards. Currently, they are trying to sacrifice the U.S. dollar to get Americans back on their spending treadmills. They have done this through a variety of ways including, making it extremely unattractive to save. With the Fed rate touching zero, many people see bank savings rates of 0.2 to 1.2 percent and wonder why should they even save a penny? Yet with the markets off their peaks by 40 percent, many people don’t mind saving their money in a secure vehicle instead of it losing value. Plus, with the employment situation so fragile, people are saving because they have too. The new austerity is on us and people need to adjust to the new reality because we are not going back to the way things were in 2000 through 2005.
If you enjoyed this post click here to subscribe to a complete feed and stay up to date with today’s challenging market!2 Comments on this post
Trackbacks
-
Ray said:
Excellent post. I think this is the reason we will ultimately see an inflationary blowout. Soon enough there will be so much money floating around the system that asset prices will have nowhere to go but up. Commodities, food, and even equities. Just my $.02.
May 15th, 2009 at 2:21 pm -
John Sanders said:
Americans are cutting back to the necessities.
Exactly what we need, but the problem I think is that the “big guys” don’t want us to not spend, so they will find a way to get us in more debt again. Guaranteed !
May 16th, 2009 at 8:47 am


 If you enjoyed this post click here to subscribe to a complete feed and stay up to date with today’s challenging market!