The Ultimate Sucker’s Rally: Record Breaking 50 Percent Stock Market Rally in 5 Months: Extreme Market Volatility Occurs in Deep Economic Recessions and Depressions. From 676 to 1002.
- 5 Comment
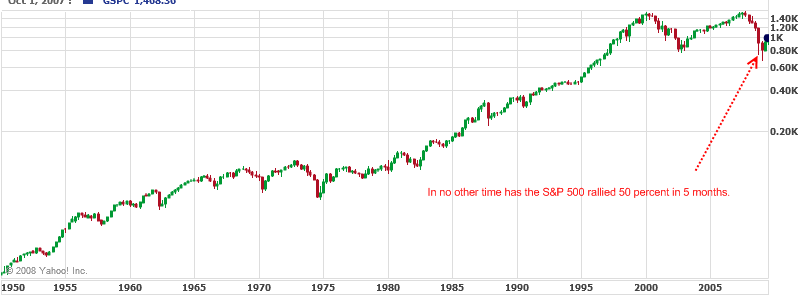
Incredible. We have never seen a stock market rally like this in all the history for the S&P 500. In no other time has the S&P index run up nearly 50 percent in the matter of 5 months. Extreme market volatility is the ultimate sign of market distress. Think for a minute and ask yourself if 26,000,000 unemployed and underemployed Americans warrants a 50 percent rally? Ask yourself if $3 trillion in commercial real estate gearing up for implosion is reason for a massive jump in the stock market? I assure you that it does not warrant the current rally but massive unrelenting blind optimism, the same blind optimism that led to the bubble, is back in fashion.
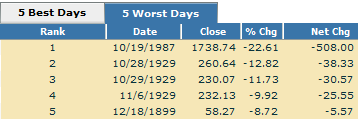
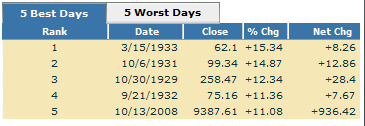
Now many people fail to realize that the best one day gains and the worst one day gains occur during periods of massive distress, not during bull markets. Let us take a look at the worst and best 5 days on the Dow:
It is rather apparent that maximum fluctuation does not mean things are going well. In fact, four of the five best days in the Dow occurred during the Great Depression and one of the five days occurred during our current massive recession. The five worst days include three from the Great Depression and the 1987 stock market crash. Let us first look at the current rally:
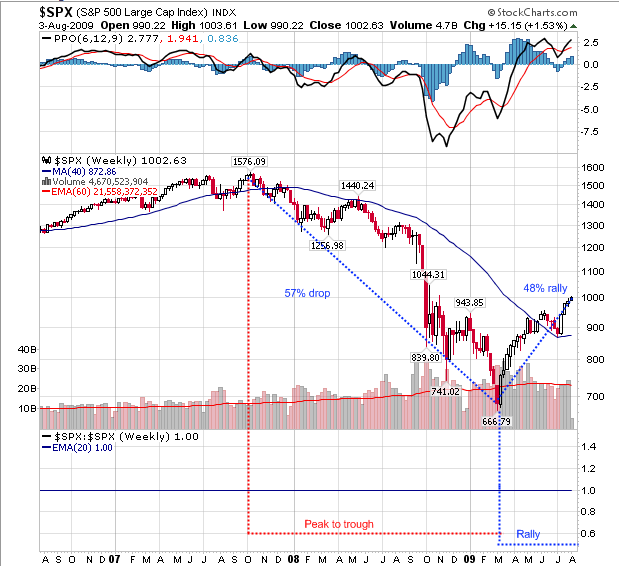
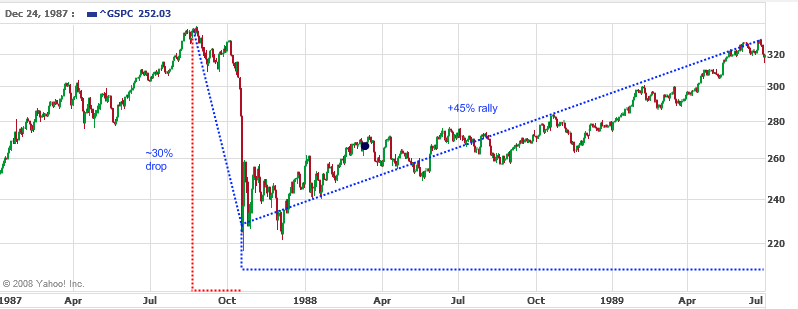
It took 17 months from the peak in 2007 to the “bottom” in March of 2009. In that time frame, we lost 57 percent in the S&P 500. A drop only rivaled by the Great Depression. Yet our current rally is going on 5 months and is flirting with 50 percent. Never have we seen this unrelenting drive up. Even after the 1987 crash, it took some time to rally 50 percent and the economy was in much better shape at that time with lower unemployment:
How long did it take? From October of 1987 to July of 1989. Not exactly 5 months. And this rally is happening with tepid earnings, massive unemployment, and the U.S. Treasury gearing up for Plan C to bailout the enormous commercial real estate bubble which will make the subprime debacle look like a walk in the empty subdivision park. If we look at a 60 year chart of the S&P 500, we will not find a 50 percent rally in the span of 5 months:
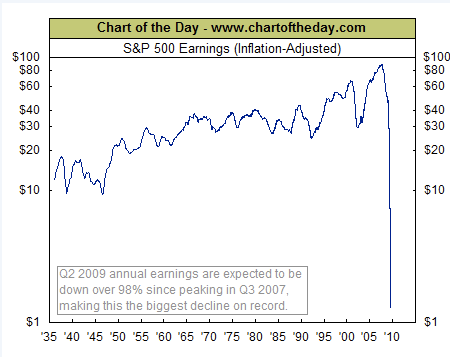
The only other time that we saw such a massive rally was during the Great Depression when the market did bottom out. But that bottom came after an approximately 90 percent drop in stock market value. So many are betting that March was our Great Depression bottom. But even then, with the mother of all economic contractions, we did not see a 50 percent rally in 5 months. The absurd irony of this all is earnings are not good. Sure, companies revise estimates to beat the street but overall they are not solid. If you need any more evidence, just look at this chart:
It would be one thing if earnings were flying off the charts and stocks looked cheap. That is not the case. Make no mistake. This is a hope filled rally not guided by the fundamentals. It is a rally based on the psychology of “well things have to get better just because” and ignoring earnings, employment, and all other indicators. It would be one thing if the market evened out. That is understandable. But to go up 50 percent in 5 months? This reeks of a bubble.  At a certain point things will pull back and it will get ugly. The recent GDP report which showed only a 1 percent contraction, better than expected, was only the case because of government spending. The consumer is spending less. That is why consumers are being egged on to spend more with gimmicks like the cash for clunkers program.
The banks are only walking because of trillions in taxpayer bailouts. The system is completely relying on the taxpayer crutch. How long can this go for? This market volatility with huge unemployment only signifies that this will be a slow recovery. The market is rallying as if this will be a short and quick recovery. I think the rally may go on because we are talking about the same infrastructure that made crappy homes double up in the matter of years so anything is possible. But one thing is certain, if earnings don’t show up and employment doesn’t start picking up we are heading back down and in a fierce way.
If you enjoyed this post click here to subscribe to a complete feed and stay up to date with today’s challenging market!5 Comments on this post
Trackbacks
-
Gry Dla Dzieci said:
Very interesting and complete review of some recent stock’s level fluctuations. This shows us many dangerous phenomenons occurring in modern economical world. The first thing here is the deep hole of recession as we see in the graph. The second is how dangerous it is to play on market nowadays – there are days that the whole life savings can shrink to an old bike value.
August 4th, 2009 at 3:38 am -
Olzj said:
An estimated 20% of the Stimulus package has been put into motion leaving 600 billion give or take a few. Just how high could you take the S&P with that kind of change? The PPT has worked very effectively convincing Americans and the world that Govt. Money can do great things! It is possible however, the lion share of spending is going into the pockets of the Boobs on CNBC cheerleading 24/7! Any thoughts?
August 4th, 2009 at 9:07 am -
Magend said:
You know folks – I see this ludicrous rally that seems to be taking place on a daily basis and my mind flashes back to an article several weeks ago of a Russian (Named) individual that had been working for Morgan (or one of the BIG WIGS) and had quit and run off to Germany with a stolen program that had the potential to manipulate the markets???!!!!
I sometimes wonder how much of the “Rally” is actually “FAKE” and when those with the power will finally pull the plug —- taking all the IDIOTS lute with them???!!!!!
Just my two cents!!!
August 4th, 2009 at 6:53 pm -
vivo said:
Good job guys! Good analysis. The suspense is on.
August 5th, 2009 at 3:11 am -
ButwaitaMinute said:
Why wouldn’t a run up like this be viewed as a symptom of inflation? Isn’t this just a case of too many investment dollars chasing a fixed (or shrinking) equity asset base?
August 7th, 2009 at 9:04 am
