Working for less – Aggregate hours worked in U.S. economy from all workers moves back to February 1999 levels. 25 million Americans out of work or looking for full-time work as middle class continues to shrink.
- 2 Comment
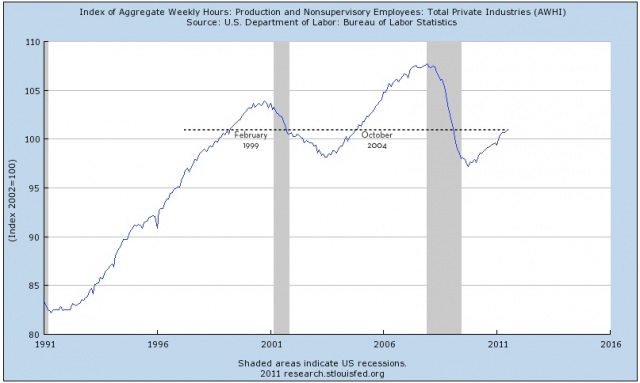
The economy continues to sputter along and the weak employment report only adds more doubt for a summer recovery. As if the American worker was in a position to support more economic bad news? Many are now looking at new methods of measuring employment in our economy since the headline unemployment rate has failed to give an accurate picture of what is going on. If we were to add all the hours worked in the economy we would find that we are now back to levels last seen in February of 1999. Now think about this for a second. We are talking about the aggregate hours of all workers in our economy. Of course, this figure is startling because it fails to account for population growth and also the expansion of the workforce. The economy is struggling more than the headline unemployment rate is leading many to believe.
Total hours worked
Source:Â RortyBomb
The above chart is a novel way of examining our current economic predicament. It seems that using the underemployment rate or U6 in the BLS reports has caught on (at least on the internet), there are other methods of measuring the true state of employment in our economy. Looking at aggregate hours demonstrates a shocking data point that we have truly experienced a lost decade. The implications are wide:
“(RortyBomb) If you add up all the hours worked in the economy in June 2011 they are roughly equal to all the hours worked in February of 1999. Is there some sort of supply-side argument about how we are less productive as workers than we were in 1999 or 2004? This is part of what people mean when they say there’s unused capacity, and that’s a tremendous waste of people’s talents and lives.â€
Why is this happening? It would appear that the wool was pulled over most Americans in the last decade. The pseudo-economic growth came from massive expansion in the financial industry and the easy access to debt. Debt was substituted for real economic growth and largely papered over the slowly deteriorating nature of our employment base. As the tide recedes and the limits of debt are being reached we are now confronting some troubling undercurrents.
Employment chart
Source:Â Planet Money
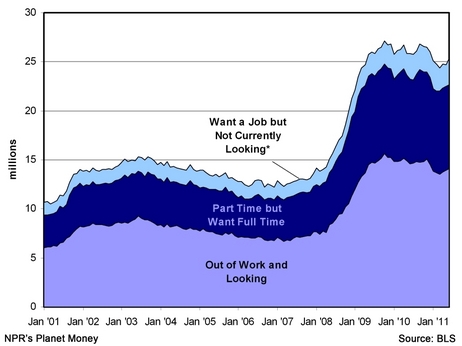
More than 25,000,000 Americans are out of work or are unable to find work. Many are also working part-time jobs as a pit-stop in finding a full-time position. The above chart also does not encapsulate the number of Americans that have left higher paying jobs and have taken full-time lower paying jobs simply because the economy has been weak for many years now. At a certain point this no longer becomes a typical recession and turns into something else. Slowly the middle class is put into the global arena and is confronting a cold hard reality. In the past where it was possible to have one blue collar job as a pathway to the American dream for a family, that is simply no longer the case with massive global competition. Part of the reason why the domestic stock market is holding up as well as it is with dismal employment numbers is the reality that many of these companies hire, employ, and sell much of their goods overseas. The financial sector bailouts which were to support the American worker largely have gone to investment banks that are simply investing and making speculative wins overseas.
The economy is facing permanent changes. In most other recessions the economy contracts, sheds businesses, and slowly rebounds with the same jobs and industries. That is no longer the case. There is little reason for the financial sector to be as big as it was during the credit bubble. The too big to fail banks are largely a drag on the overall economy since they need to draw on large amounts of taxpayer funds to sustain their brittle balance sheets. Yet this comes at a great cost to the economy.
Long-term unemployed
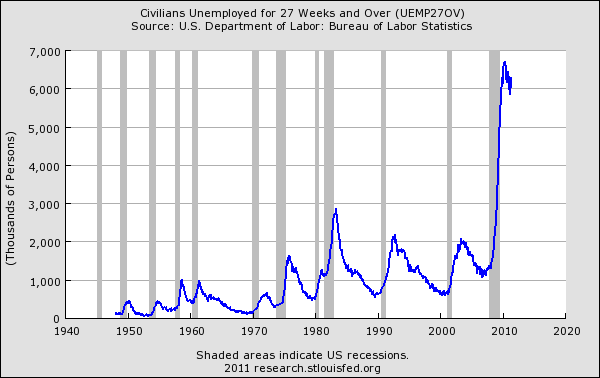
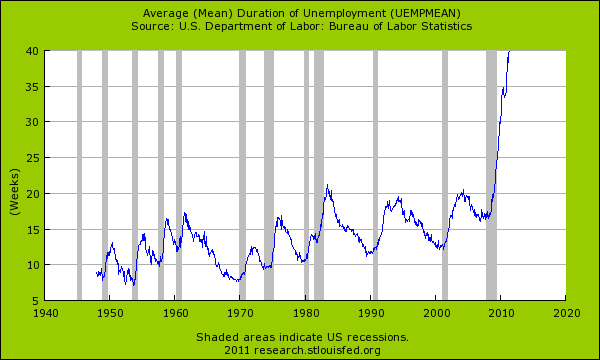
Approximately 6,000,000 of the unemployed have been out of work for more than half a year. The data is likely grimmer and I am certain if we extended the chart out we would have millions that are out of work for more than one year. What does this tell us? In all likelihood many of these jobs are gone for good. It will be hard for many to shift into other industries since the dynamics of this recession are unique. In fact, the average duration of unemployment is now up to a record of 40 weeks:
Take for example the recession that came after the tech bubble burst. Many that lost jobs during this time easily switched into the boom that came from the housing bubble. Many jobs in the financial service industry, mortgage market, and construction business did not require a college degree. The transition was rather seamless. If you look at the above chart you can see how quickly the long-term unemployed rallied in the early 2000s. That is no longer the case. Many of the jobs with higher wages now require advanced training and advanced degrees. This takes time to gather. Yet there are now pitfalls as well since the higher education bubble has set itself up to pick up this slack. The danger is picking a low quality school and coming out with mountains of student loan debt. Even those going to good schools are having a challenge in this economy. It appears that things are tougher, jobs are more scarce, and little is being done to support the long-term growth of the middle class.
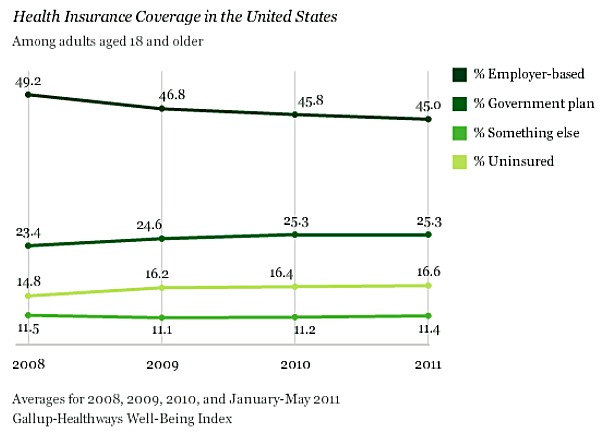
The economy is hobbling along and even though the stock market inches closer to its peak levels, most Americans realize something at a much deeper level is fundamentally different. The path to a middle class lifestyle is getting narrower and many now realize this. Take for example data on employer supported healthcare coverage:
Source:Â Gallup
Only 45 percent of Americans now have health insurance through their employers. Equally startling is the 16.6 percent that have no insurance at all. The employment figures are one facet of the larger storyline of a shrinking middle class.
If you enjoyed this post click here to subscribe to a complete feed and stay up to date with today’s challenging market!2 Comments on this post
Trackbacks
-
CLARENCE SWINNEY said:
ONCE MORE I MUST TELL YOU HOW GREAT IS YOUR INFPORMATION
YOU MUST HAVE OUTSTANDING STAFF TO DO IT.
THANK THEM FROM AN OLDUGLYMEANHONESTPOLITICALHISTORIANJuly 11th, 2011 at 8:35 am -
NOTaREALmerican said:
Good post. Hours worked! Hadn’t heard of that measure before. It does make more sense than the various U’s and their adjustments.
Would be nice to see this adjusted for population growth (but not sure if the unknown number of illegal immigrants might make it pointless).
July 11th, 2011 at 3:48 pm
 If you enjoyed this post click here to subscribe to a complete feed and stay up to date with today’s challenging market!