5 Key Housing Stats: Examining the U.S. Housing Market in May 2008.
- 0 Comments
The debate has shifted in the last few months with many now feeling that the credit crisis is behind us. Many are now looking forward thinking that the worst in the housing market is here and we are now nearing a short-term bottom. However, others have likened the current environment to being in the eye of a hurricane; that is, the calm right now is very temporary and we still have a large storm heading our way. In this article we want to examine 5 key housing stats that still show major weakness in the U.S. housing market:
#1 – Delinquency Rate

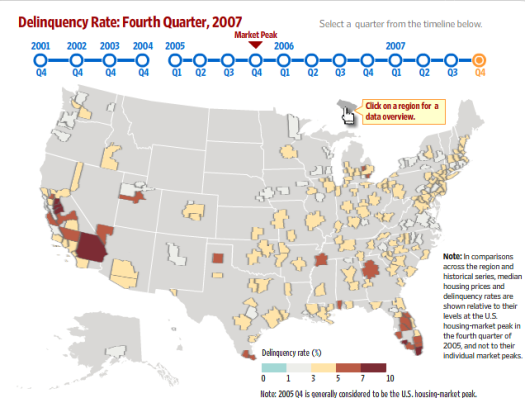
*Source: Wall Street Journal
The first item we want to examine is the concentration of delinquencies. We still need to remember that many states across this nation did not face massive appreciation during this decade. The few inflated regions appear to be congregated in the Southwest (in particular California and Nevada), Northeast, and Florida. If you look at the above chart, the darker regions show higher distress areas; you can see that California and Florida are facing some very challenging times ahead. These areas also have large amounts of inventory and with the doors closing on lax lending, many families in these areas are unable to get loans. The market has dwindled.
#2 – Case-Shiller Index

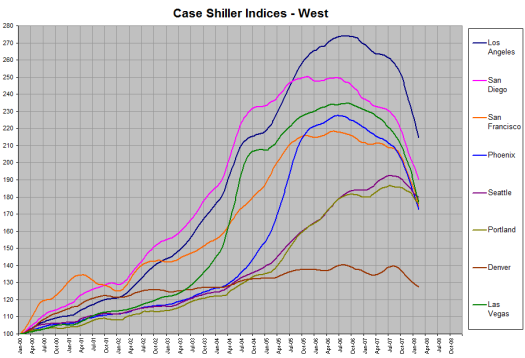
*Source: housingbubblebust.com
The second key point is rather a self-fulfilling prophecy. As prices went up, appraisers looked at recent sales to assess current prices, and prices kept going higher and higher. The opposite is now happening. Much of the sales in highly distressed areas are foreclosures, REOs, and short sales only suppressing prices further. We had a burst of realization by lenders that prices were not turning around and now, there is this exit out the doors pushing prices lower. This almost assures more price declines.
#3 – Energy

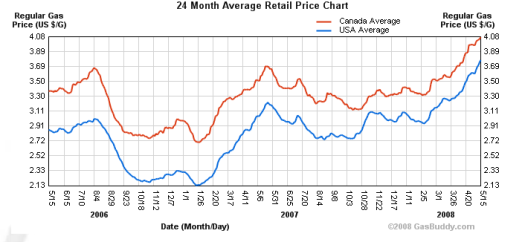
You may be asking what does fuel have to do with the current problems in the housing markets. Ironically, many of the out of the way sub-divisions in the Inland Empire in Southern California and other areas in Arizona are already hurting and adding higher fuel costs are only going to make long commutes that more unattractive. A long commute itself is unattractive and even during the boom, many builders were developing downtown areas seeing a renaissance in urban dwellings. The idea of the McMansion is now losing its luster and $4 or even $5 a gallon gas is going to hurt these areas even further. Expect to see ghost towns in some of these areas in the next few years.
#4 – Housing Starts

Aside from all the desperate short-term fluctuations in housing stats, the overall trend is clearly downward. What the above multi-decade low in housing starts shows us is that housing was extremely over built in this past decade. Until housing starts start trending upward by a significant margin, there really is no point in talking about a bottom. Builders are like a reed in the wind, they were the first one’s in and the last one’s out. They’ll come rushing in once the fundamentals make sense again but that is years away.
#5 – Consumer Debt

Finally, the consumer is completely strapped. Even with the rebate checks which amount to maybe 1 month of fuel and groceries, not much is going to change with the large amount of consumer debt. Consumers that have limited access to credit are not going to be in the mood to purchase homes. In fact, if the economy continues on a path that looks like a recession, consumers are going to tighten their belts even further. More and more of a consumer’s household income is now going to simply servicing current debt. The credit crisis will guarantee that this will go on for awhile longer given the bad debts on many lenders books.
When these key stats change, then we can start looking at housing really making a turn but we are still in the eye of the storm here.
If you enjoyed this post click here to subscribe to a complete feed and stay up to date with today’s challenging market! If you enjoyed this post click here to subscribe to a complete feed and stay up to date with today’s challenging market!