The Second Derivative: Employment and the Mounting Job Losses. Measuring the Velocity of Job Cuts in the Current Recession.
- 4 Comment
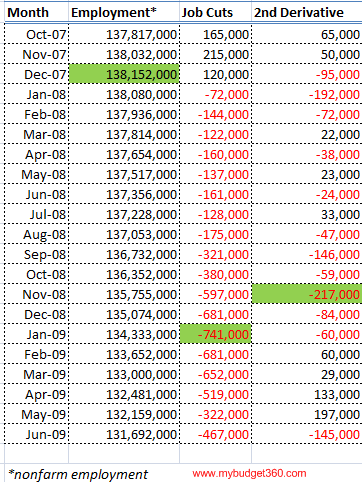
In addressing the unemployment situation it is important to look at the velocity of job losses. In January of 2009 we had a stunning 741,000 jobs lost in one month. This by far was the biggest one month cut during the current recession but it wasn’t the biggest one month change. The worst month came in November of 2008 when we saw a net increase of 217,000 more job cuts in one month from the previous month. With 26,000,000 Americans unemployed or underemployed it is important to understand how the job market data is calculated.
Last week the market sold off heavily not so much on the unemployment rate which ticked up to 9.5 percent but more on the net monthly change in the severity of job cuts. In fact, prior to last month we had four consecutive months where each subsequent month seemed to get a little bit better. In most cases this is called the second derivative but the June data put any notion of this trend to an end. I have put together job data for the recession:
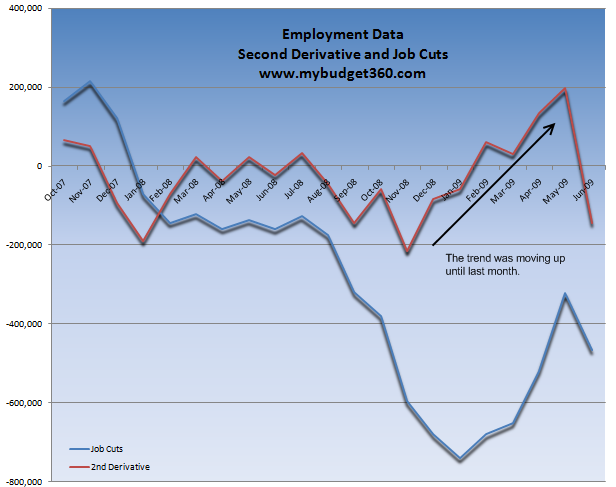
From this employment data you get a clear picture of what is occurring. Since November of 2008 to April of 2009 each month saw 500,000+ job losses. This was significant. The drop in the May data was big not so much for the 322,000 jobs lost but because it was the biggest monthly change on the downside for the entire recession. That is, from April to May we saw a 197,000 shift. Yet that was washed away in the June data. With recent market volatility it is understandable that the market is tracking the employment data carefully. If we plot this data you have a better visual of the trend:
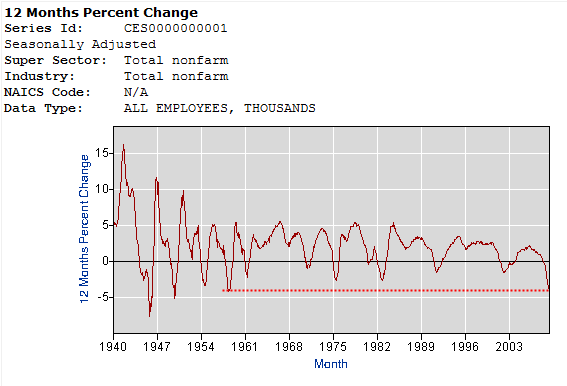
Since the recession started in December of 2007 some 6.4 million jobs have been officially lost. The last time we saw this severity in jobs losses was back in the 1950s:
Keep in mind that we are using data from June 2008 to June 2009. What this means is we are including June, July, and August of 2008 which had sub 200,000 job loss months. Once we hit September data, the 12 month percent change will surely put us into the record books. Since September of 2008 the average job loss per month is 536,000.
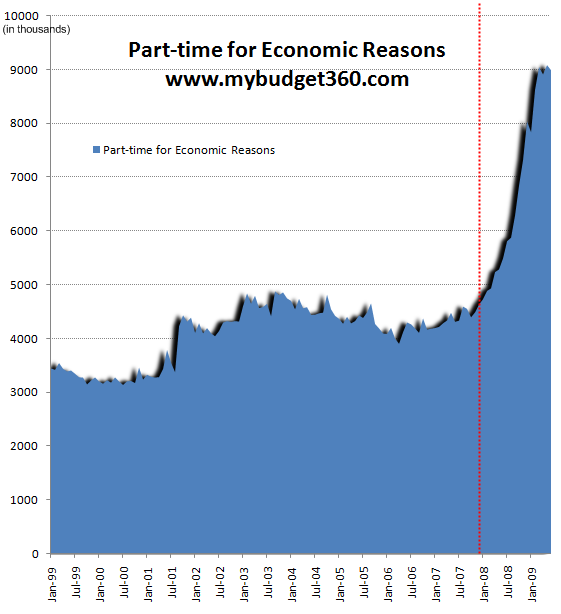
What the latest employment report tells us is that the economy is still on shaky ground given that this is now playing out like a minor depression. The 9.5 percent unemployment rate understates the gigantic number of people now working part-time but looking for full-time work:
Since the start of the recession those working part-time for economic reasons went from 4.6 million to 8.9 million. Keep in mind that these people are counted as employed with the headline 9.5 percent unemployment rate. These could be people working 10 or 15 hours a week making up for a full-time job they just lost. Given the large size of this population, it is an important caveat to keep in mind when we hear the headline figures rattled off.
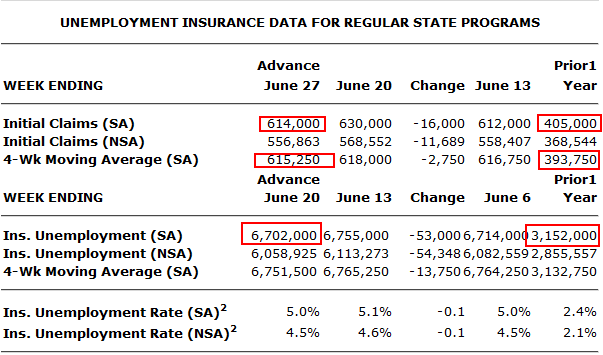
Initial unemployment claims remain stubbornly high above the 600,000 mark. This is another good indicator to look at to see whether employment is improving. Unfortunately the severity might have slowed a bit simply because employers aren’t hiring any other people. That is, job cuts might slow in the next few months but signs of hiring are nowhere to be found. The latest data shows 5 people that are unemployed are competing for each 1 job opening. The UI claims show how quickly things have changed:
Until we get to roughly 400,000 initial claims per week any recovery talk is premature. The second derivate is absolutely vital for the average American family who has seen their net worth obliterated by the multi-decade housing bubble and simultaneous stock market bubble. Many are now looking at employment for any signs of a turn around.
If you enjoyed this post click here to subscribe to a complete feed and stay up to date with today’s challenging market!4 Comments on this post
Trackbacks
-
Ray said:
Bbbbbbbut I thought the recession was over. Dennis Kneale said so.
July 8th, 2009 at 9:22 am -
Cash Back said:
It is a little scary to see all of these employment stats. With so many more people losing their jobs, it’s tough to envision this getting better anytime soon. It seems like things are still bound to get worse first.
July 9th, 2009 at 12:32 pm -
Marlon said:
I think it’d be interesting to calculate this on private sector jobs, since those are the ones that pay for the public sector.
I’d also like to see it calculated as a percent of total remaining employment (either private or total non-farm) since, at some point, monthly job losses will begin to decline due to there being fewer jobs left to lose.
(Economics is a more dismal science if you don’t know how to think about it, or dare to.)
July 10th, 2009 at 2:46 pm -
jay @ work at home said:
It is important to know that even though the DOW is up that doesn’t mean the job market is up. Millions of people out of work is worse dating back to the great depression.
August 8th, 2009 at 1:01 pm
