Suburb Cat Thousandaire: How Americans Lost a Decade of Wealth through Debt and Listening to the Banking and Housing Industry.
- 2 Comment
Not all that glitters is gold. And not everyone touting to be a financial expert should be regarded as such. Americans have lived in what could be considered a decade built on a debt façade. As many Americans strolled their neighborhoods, possibly taking the dog out for a walk, many suddenly would come across a neighbor with a new sleek silver Mercedes Benz or other foreign car. Many thought, “how could it be that they now have the means to afford a $100,000 car?” At this point, many could have resisted the siren call but many actually mistook debt for wealth and went out and went into debt to also get a luxury car. This story replayed itself many times over especially with the allure of the 3 decade long housing bubble.
The Federal Reserve issued its Survey on Consumer Finances last week and this largely went underreported because the fixation has been on the stimulus plan. Yet this detailed look at the finances of American families shows us how the average American household has lost a decade of wealth largely in part to the obsession created by the housing and banking industries (two industries now draining the government for incredible sums of money). Many are now awaking from their debt slumber to realize that the luxury car, the large home, and all the household amenities financed by debt were never really an asset. It was a borrowed identity. It was as if millions of Americans had the chance to live the life of a tiny millionaire even though they had negative balance sheets. The survey highlights this problem.
In this article, we are going to examine the balance sheet of the American family to see where the money actually went. We will try to break down some of the myths but also look at the menace that is deflation that shows up in lost wages and declining home values, which apparently has shocked many in the mainstream media but is very predictable if you only follow the money. What we will find in the article is how the top 10 percent of our country have had a largely profitable decade while the other 90 percent have been running in the same place and falling back.
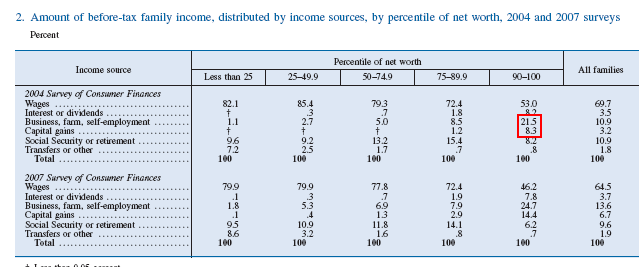
The first chart we should look at is the source of income for most Americans. There is this large notion that most people are self-employed but this in fact is a myth. The large majority of Americans actually earn a paycheck from an employer. Another important point is 75 percent of Americans don’t derive any income from capital gains yet we constantly hear about this. Let us look at a chart highlighting some fascinating data:
So what can we gather from this data? For both 2004 and 2007, nearly 90 percent of Americans derive most of their income from wages. Business, farm, and self-employment income makes up a very small percentage of income for 90 percent of Americans but for the top 10 percent, it makes up 21.5 percent. Capital gains are virtually invisible for 75 percent of Americans and creeps up for those in the 75 to 89.9 percentile range.
This survey is released every 3 years. So what happened in 3 years? For the top 10 percent, in 2004 “business, farm, self-employment” and capital gains made up 29.8 percent of the income for those in the top 10 percent. Guess what happened in 2007? Those 2 sources now made up 39.1 percent. Next time you hear the cries of capital gains just remember who they are talking about here.
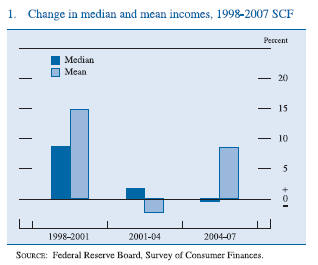
So we have established that the vast majority of Americans derive their income from their wages paid by employers. So how did wages do over this time?
You’ll first see some strong growth for the 1998-2001 survey. I would venture to guess that a large part of this was due to the tech bubble. But the startling data is for the 2001-04 and 2004-07 data. The median income has fallen over this timeframe. The disturbing point is that for the most recent survey, the mean income has gone up and this was largely based on the stock market and real estate bubble which benefited the top 10 percent while neglecting the bottom 90 percent. You need only look at the data to verify this information. Plus, it isn’t like the Federal Reserve is actually trying to encourage Americans to save although this data is screaming for us to do so. Yet a point emerges and that is, the Fed may actually realize that Americans have nothing to save hence their lack of focus on increasing savings. It is a moot point.
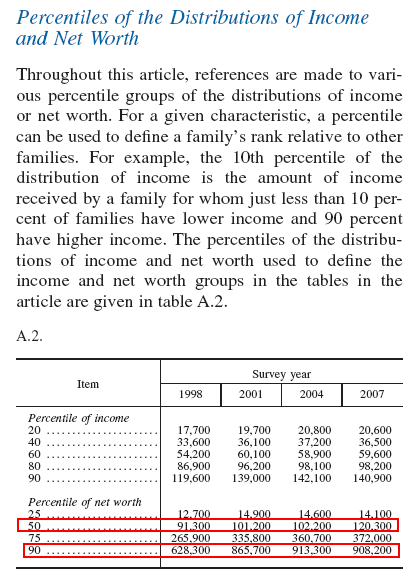
The survey is rich with data. The place where this wealth discrepancy is shown the most is when we look at the actual numbers for income and net worth:
For the latest survey, 80 percent of Americans families make less than $98,200 and 90 percent make less than $140,900. And any financial expert worth anything realizes that true wealth is signified by your net worth. That is, assets – liabilities = net worth. If you have a $700,000 home but owe $800,000 you are not wealthy although people that look at your home may think you are. Yet as we all know, most Americans loaded up on real estate which is now in a major decline and this data largely does not capture this fall. The true story is revealed on that net worth figure.
For those at the 25th percentile net worth increased by $1,400. (11%)
For those at the 50th percentile net worth increased by $29,000. (31%)
For those at the 75th percentile net worth increased by $106,100. (39%)
For those at the 90th percentile net worth increased by $279,900. (44%)
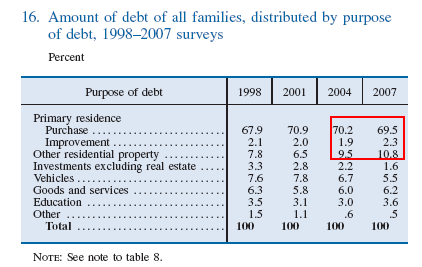
When you start breaking down the numbers you can see who has been doing the best this past decade and at the expense of the vast majority of Americans. The next chart I want to show is the massive amount of debt used to fuel the real estate bubble:
It is interesting to note how much money was funneled into real estate during this time. The biggest debt for the majority of Americans is the primary mortgage. This steadily increased from 1998 to 2004. You also see a jump in debt to finance “other residential property” as many bought vacation or investment properties. This slight jump is big since the mortgage market is over $10 trillion. But take a look at debt to finance other investments aside from real estate. It falls in half over this decade. This tells you where people were dumping their money.
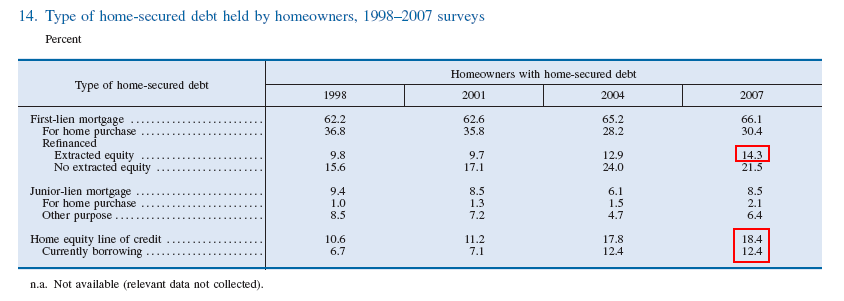
Another chart shows us that many Americans took out more equity from their homes but also used this money to finance other real estate purchases:
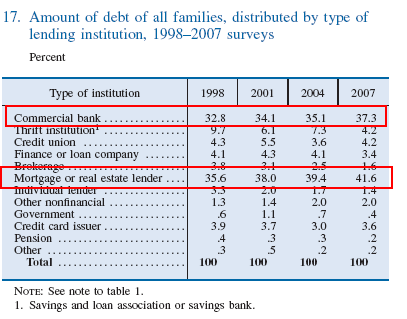
So as you can see, the obsession with housing has been a very bad move financially for our country. So guess who is on the other side of the equation?
Debt to commercial banks and mortgage or real estate lenders steadily increased over this decade. And guess which institutions are asking the government for the largest sums of money? It is that top 10 percentile that actually profited the most during the boom times. And as the data shows us, the average American household hasn’t had a jump in wages over this entire time.
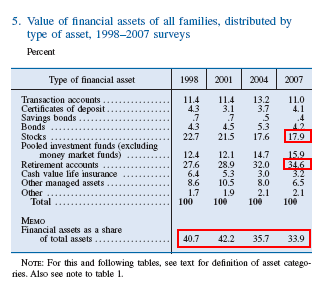
Interestingly enough, over this past decade Americans as a whole have pushed away from financial assets. Take a look at this chart:
Only 17.9 percent of Americans own stocks outright but what has grown is the usage of retirement accounts which of course are simply a different way of holding stocks. And this was an unfortunate move. Since stocks and retirement accounts make up over 50 percent of the financial assets, many have seen large declines since the markets have shed nearly 50 percent of their values.
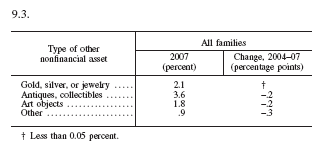
As much as Americans want to consider that they are diversified they are not. Consider the amount of Americans that own psychical gold as an asset for example:
Just to give you a sense, gold was at $270 back in May of 1999 and is now at $950 an ounce. Most of the time gold was seen as an archaic form of holding on to your money but this is just to highlight how ill diversified Americans were for the economic shock we are going through. Diversifying meant to many that you owned a bunch of U.S. stocks and real estate in a few locations. Even if people had 10 percent in other assets aside from real estate and stocks, many would be in better shape. Yet much of this comes from the structure of the system. The obsession with housing and debtor mentality are now going to come under direct fire.
The data in the survey shows us that many Americans were really just borrowing the artifacts of wealth for a few years. Ironically, those that made the loans are asking the government for a bailout while most Americans are losing their main source of income, their wages.
If you enjoyed this post click here to subscribe to a complete feed and stay up to date with today’s challenging market!2 Comments on this post
Trackbacks
-
Jim Robinson said:
These people crying in there beer!
should have bought less champaign and more beer,
they did it to them self. Just because you can get a 0 down loan
dose not mean you should!February 17th, 2009 at 11:49 am -
Lawn Care Tips said:
When the interest rates were lowered, mortgages were given out to people that shouldn’t have gotten them. They did not have the ability to pay them back. The government did regulate the banks for nearly a decade now. As unemployment and consumer spending drops, the market reflects this. Profits drive the market in the long run, so when there are less profits in companies, there is less of a reason for investors to pump capital into these companies, especially certain bank shares.
June 8th, 2009 at 10:06 am
 If you enjoyed this post click here to subscribe to a complete feed and stay up to date with today’s challenging market!