Is the California True Unemployment Rate at 18.47 Percent? The 10.1% Headline Number is the Highest Rate in Over a Quarter Century. 1.8 Million Workers Unemployed in one State. How Many are Partially Employed or Have Given up Looking for Work?
- 6 Comment
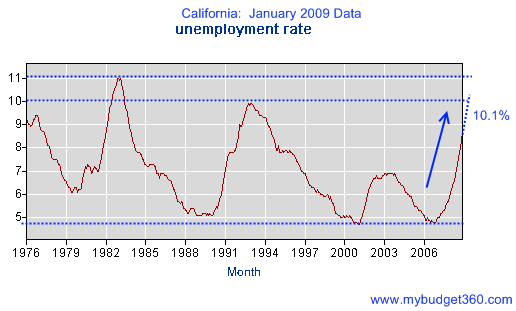
California is a microcosm of the entire United States. The most populous state with a GDP of $1.8 trillion, much of what happens in California does spread throughout the country. California’s employment situation is deteriorating at a breathtaking speed. The latest employment numbers were released after the bell closed on Friday, which now seems to be a common trend when news is less than comforting for the soul. The unemployment rate in California has now shot up to 10.1%, a number not seen since May of 1983.  And what is even more troubling is how quickly the rate is increasing in tandem with a $42 billion budget deficit that will, at least for 2 years, hamper the state’s growth.
The California unemployment figures are derived from a survey of 5,500 households. For the previous month, 257,000 additional people were added to the unemployment statistics in California. Sometimes we forget the actual repercussion this has for countless families and Americans that are now struggling to make ends meet. How many of these families will now be unable to pay their mortgage on top of the millions already struggling? How many of these families will now cut back further on consumption which is the life blood of our nation’s economy (whether this is good or bad)? The bottom line is this kind of unemployment trend will continue to hurt the state economy.
Before we go on, let us first look at historical unemployment rates for the state:
I’ve added last month’s data to the chart and you can see how quickly things are changing. What is more stunning is that you’ll see in the late 1970s, unemployment was already over 7% so the jump to 11% in 1982 was an increase of 4% in the span of two years. In our current situation, the California unemployment rate as early as of November of 2006 was sitting at 4.8%. We’ve increased 5.3% in that same time span from the late 1970s to early 1980s. What this means is the velocity of job losses is faster than what the state experienced during the early 1980s. Much of this of course is happening because the California housing market had the biggest housing bubble and now has burst, falling 50% from peak prices and is still showing no signs of pulling back.
And this presents a double-sided problem. Much of the wealth for California was derived from housing related industries; construction, finance, and anything related to buying/selling homes. And given that recent estimates show that housing is expected to fall another 20 to 25 percent, we can expect that at least for California, we are going to need to find other industries to pick up the slack that will be left from the bursting housing bubble. No industries have risen like the Phoenix to make up for this large slack. The number is simply jaw dropping. Currently 1,863,000 Californians are out of work by the standard unemployment measure. Of course, how many others are underemployed, working part-time jobs, or have simply given up looking for work? If nationwide, the unemployment rate is 7.6% but the U-6 number which includes part-time workers and those who have given up looking for work jumps to 13.9%, we can try to run a similar ratio:
(7.6 / 13.9) = (10.1 / X)
X being the U-6 rate for California
X = 18.47%
Now of course this ratio may or may not hold up given that trends nationwide vary. But given that California is ranked in the top 5 states with the highest unemployment rate, it would only logically follow that the U-6 rate, if there were one for the state, would be at this level. And I think this is a fair estimate. That is why I think this recession feels much deeper than that headline 7.6% unemployment rate nationwide. The good thing is that I have found that a few articles from the WSJ and NBC now quoting the U-6 number.
Given last month’s number, a jump of 257,000 in those who are unemployed would have made up a stunning 42% of the jobs lost in January nationwide, which came in at 598,000. Just think of that figure in context to our country as a whole. Nearly half of the jobs losses nationwide in January came from California.
And the year over year numbers are even more startling. Compared to January of 2008, California has added 754,000 additional people to the unemployment lines. Or a steady rate of 62,800 people per month. But given that 257,000 lost their jobs in January of 2009 we can see that the speed is accelerating.
Of those that are unemployed 990,600 people were laid off while 126,700 left their jobs voluntarily. This nearly 9 out of 10 ratio is showing that most people are not leaving by choice. The hardest hit industries are:
Construction
Manufacturing
Trade
Transportation
Utilities
Information
Financial Activities
Professional and Business Services
Leisure and Hospitality
Other Services
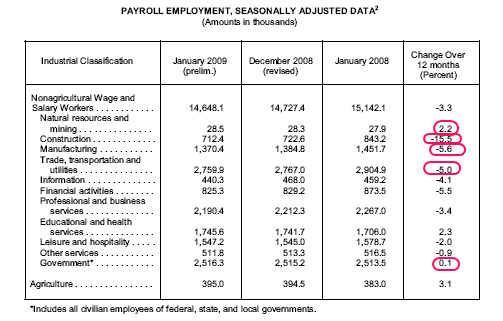
With these industries alone 537,000 jobs were lost in the last year making up the majority of the job losses. And this would logically follow with the housing bubble bursting. Let us look at a chart put out by the Employment Development Department of California:
The biggest sector of employment trade, transportation, and utilities saw a decline of 5%. Construction fell by a stunning 15% during this same period. Education and government posted slight gains but these two sectors make up only 29% of all jobs and given the deep budget deficit of California, there are hiring freezes and job cuts that have been occurring in these sectors. Across the board job losses are occurring.
Currently 717,525 people are receiving unemployment insurance benefits. This compares to:
December 2008:Â Â Â Â Â Â Â Â Â 655,445
January of 2008:Â Â Â Â Â Â Â Â 480,858
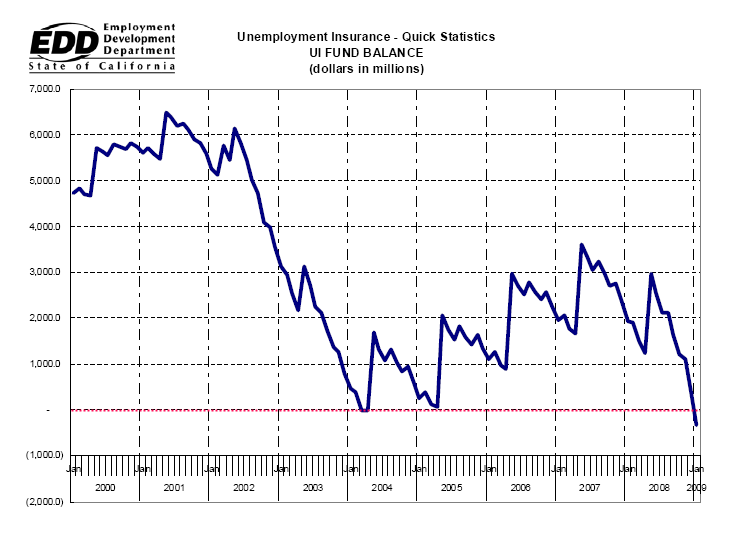
This is simply another strain on government. And some people think this number is high but the max that is paid out is $450 per week with the current average at $312. The unemployment insurance fund now is running below zero:
In fact, it looks like with this latest release we crossed that figure. Given the above, this is going to be a very trying time for California and our nation. It will be crucial to keep an eye on these figures to see how things change over the next few months.
If you enjoyed this post click here to subscribe to a complete feed and stay up to date with today’s challenging market!
6 Comments on this post
Trackbacks
-
Jon Jost said:
ever interested in real economic analysis
February 28th, 2009 at 4:36 pm -
Elinor Cruze said:
The most populace state …
populace (n): all the people; population
populous (adj): having lots of peopleMarch 1st, 2009 at 12:31 pm -
Sharonsj said:
I think it’s telling that the top six industries are those that use illegal aliens, imported aliens, or are outsourced. That’s why so many Americans in those fields can’t find work.
March 1st, 2009 at 2:26 pm -
Steve Justin said:
Unemployment rate in the rest of the US is probably just as bad.
No one wants to admit it, especially the BLS. Job fairs where the
employers have no jobs. Staffing agencies that are super slow.
500-1000 applications for the every job opportunity. Employment opportunities that are two years old on some websites. To make
the employment sites look full. The job market has just about collapsed. It’s the same everywhere.March 20th, 2009 at 12:21 pm -
Robert Brown said:
Thank you for the information and data. It is very helpful. I lost my job last month and found new job with the help of http://www.bigjobsboard.com I think people need to be patience in looking for a stable job.
September 11th, 2009 at 4:33 am -
Jeff Iaconis said:
Counting my injury which took place a year ago in Aug, I have been out of work since 9-1-2010, which means that I have been off work a total of 16 months, it’s getting real close to the 1.5 year mark. This is one mark that I thought I would never EVEN come close to again. God Willing this will be just the break I needed to finally finish off my schooling, and I should be able to find suitable employment within 6-12 months. To be sure I have made mistakes, the best I can do is to avoid the same mistakes in the future and focus on things at hand, tunnel vision is what I need at the present time. Distractions are exactly what I do not need right now, focus, focus and more focus are what I need. I do not plan on being just another statistic…..
January 5th, 2011 at 2:30 pm


 If you enjoyed this post click here to subscribe to a complete feed and stay up to date with today’s challenging market!