Broken financial generations – U.S. households only have a median of $2,000 saved in retirement accounts. The median net worth for those 25 to 34 is $3,700. Which generation will support the economy going forward? Social Security beneficiaries make up 19 percent of all Americans.
- 3 Comment
I recently had a conversation with a retired neighbor, a former Navy vet who worked most of his life at a local grocery store. I wouldn’t call him wealthy but he has his financial house in order; he paid off his home in the early 1990s, has no other debts, and lives well below his means. His big source of income comes from Social Security. We talked about the current economy and the strain we are facing. It was a good conversation and ultimately the mathematical problems we are facing for the working and middle class become extremely obvious when confronted face to face. We both conceded that government retirement programs will have problems in one or two decades (doesn’t help many who are still working). The economic issues faced between the generations will cause many hard decisions down the road.
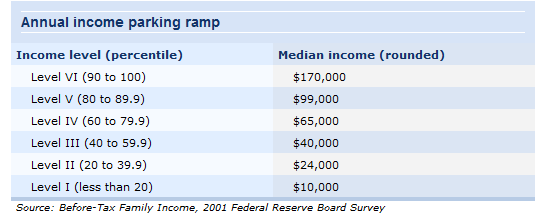
First, we should examine income levels in the U.S.:
Source:Â Bankrate
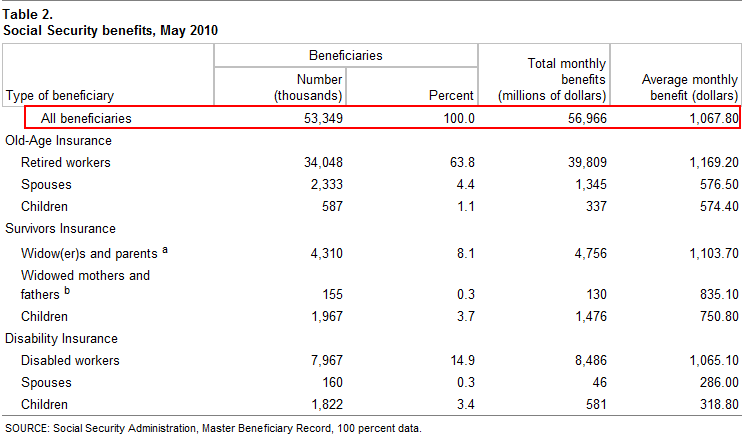
The bulk of American households bring in $65,000 a year or less.  The current tax rate for FICA (Social Security and Medicare taxes) comes in at 7.65% with the remainder paid by the employer. So the family making $65,000 a year is paying roughly $5,000 a year into FICA. With the employer match, this figure comes out closer to $10,000 going into the system. If we look at the current amount paid out to Social Security beneficiaries it is roughly the same per year:
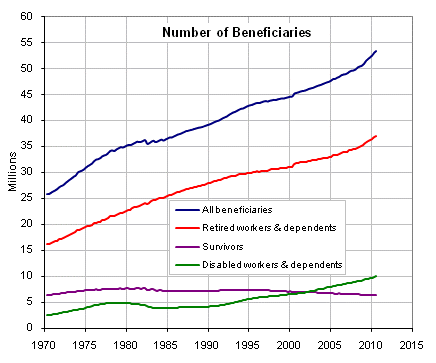
The average monthly benefit paid out is $1,067. Over 53 million Americans receive some form of Social Security benefits. The working and middle class have had an implicit agreement with the government that if they work for many decades that in the end there will be some sort of safety net to protect them. Yet the system was designed at a time when people died at earlier ages and we had many more workers than we had beneficiaries. The math now is tipping in a very unfortunate direction:
As of today, nearly 19 percent of all Americans receive some form of Social Security. Compare this to 1970 when only 12 percent of all Americans received some form of Social Security. The above chart is merely going to grow even faster as many more baby boomers enter into retirement.  For those in the working to middle class the prospect of a secure retirement is looking more and more remote. It would be one thing if people had the ability to trust in Wall Street and invest into the market. Yet Wall Street with no real reform is largely a predator casino as we have seen with flash crashes and large hedge funds making billions of dollars betting on the failure of Americans.
The original Social Security Act was signed in back in 1935. The initial design was to help the old, widows, and children of the poor to have at least some basic safety net. It was never designed as a long-term retirement program. Today, over 50% of those that receive Social Security benefits in retirement use it as their primary source of income. With Americans living longer, the strain on the system is largely taken on by the working generations.
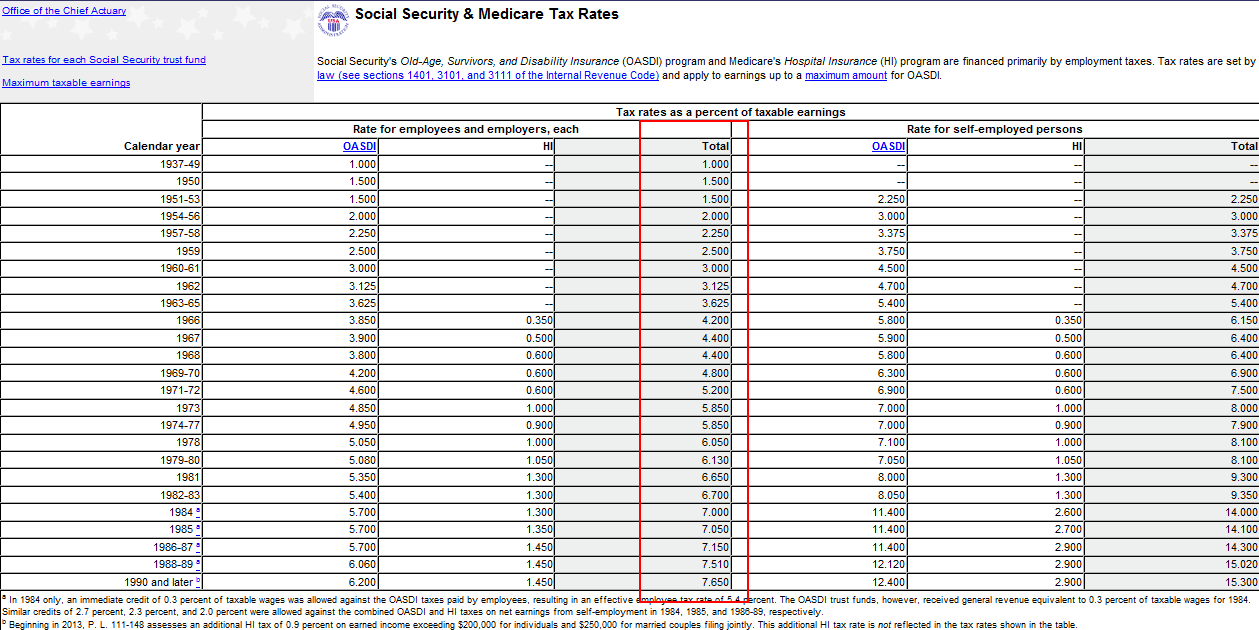
Here is an interesting chart showing the progressive growth of the tax over the century:
Initially, the amount taken out of a typical worker’s paycheck was 1 percent. Today it is up to 7.65 percent (not factoring in the employer’s portion). It is also the case that SS is capped at a certain income level so the wealthy actually stop paying above a certain level (as of 2010 this level is $106,800). Going back to a previous chart, you see that nearly $57 billion was paid out in May alone. The demographics of the system only point to larger and larger monthly payouts:
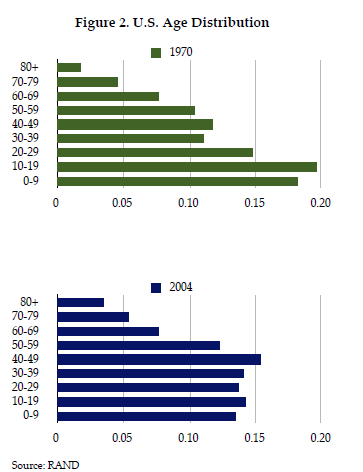
The above chart is similar to charts in Europe although not as extreme. But we see a shift to more and older Americans. By default, many of these people will start drawing more and more on the already strained Social Security system. And younger workers in our current economy are facing a much deeper impact of the current recession. Even before the collapse of the system, the young were already losing ground:
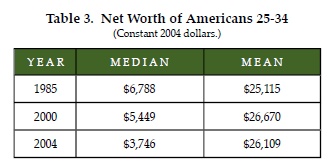
The median net worth of Americans from 25 to 34 has consistently dropped since 1985. There was a big drop from 2000 to 2004 and I would imagine the trend has accelerated in the current recession. Yet how were people able to continue buying more and more? It was all fueled by access to debt. It was largely a debtor mirage that kept the economy going in the last decade. In fact, the median amount Americans have saved in a retirement account (those still working) is $2,000:
Source:Â BLS
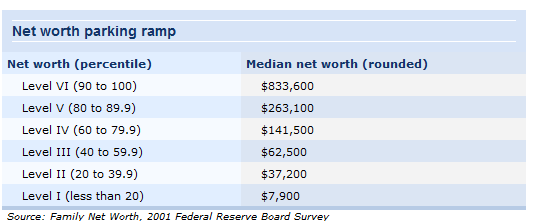
The fact that the mean is $50,000 tells us we have massive income disparities in the system and it also helps to point to the fact that most stock wealth is concentrated in the hands of a very few. Another deceiving factor that was brought into the net worth equation was the net worth figure used housing values during a bubble to calculate net worth:
A giant part of net worth was pulled from housing equity that has now largely evaporated. The fact that half of U.S. households only have $2,000 in retirement accounts tells us that many are close to a zero net worth after the housing bubble burst:
“(National Review) The macroeconomic consequences of this shift toward low-equity homeownership are visible in research from the Federal Reserve that examines the assets and liabilities of U.S. households. In the first quarter of 2001, U.S. households’ home equity stood at $7.7 trillion, or 61 percent of the value of all residential real estate. By the third quarter of 2008, it had declined to $7.6 trillion, even as outstanding mortgage debt increased by $5.6 trillion over the same period. By the first quarter of 2009, home equity was $1.35 trillion lower than it had been in 2001. Put another way: Despite the housing boom, the portion of residential real estate actually owned by households declined. This means that the increase in homeownership rates (and the subsequent rise in housing prices) was entirely debt-financed.â€
In other words, say someone bought a home in 1998 for $100,000 and took out a $95,000 loan. At purchase, they have a net worth of $5,000 (assume no other assets). Fast forward to 2006 at the peak of the bubble and the home is now “worth†$250,000. Seeing that they now have $155,000 in equity, they decide to pull out $75,000 pushing their total loan amount to close to $170,000. The money is used to buy goods, take a vacation, and generally injected into the economy. The housing bubble explodes and the home is now worth $150,000. Yet they have $170,000 in outstanding loans. This family went from having a $155,000 in equity (net worth) to suddenly going to a negative equity position of $20,000. Today, one out of three U.S. homes with a mortgage is underwater. This is why actual wealth is a better measure of financial well being than simply looking at home values especially in a bubble.
The higher unemployment for younger generations is making it harder to put more money into the Social Security money funnel. The low savings from the working generations tells us that many simply cannot save given the current economy. Ironically, this means that many more will be dependent on government programs. The calculus is troubling. There are no easy answers to this. A few of them include raising the cap to tax higher incomes or cutting benefits. Seeing how powerful groups like the AARP are, it is doubtful benefits will be cut.
As I think back on the conversation with my neighbor that has served our country proudly in combat, how can you begrudge him? He is living modestly, paid off his house, and let us be honest, $1,100 a month isn’t exactly Donald Trump territory.  Yet as I go out to work with millions of others, we wonder how things will be in one, two, or even three generations. Having a paid off home and no debt actually sounds like the apex of a good retirement given our current financial predicament.
If you enjoyed this post click here to subscribe to a complete feed and stay up to date with today’s challenging market!3 Comments on this post
Trackbacks
-
Alan8 said:
Increase Social Security and tax the rich to pay for it!
The rich have stolen trillions of dollars from the American taxpayers through their corrupt politicians and stolen elections. It’s time to take some of that money back!
Make the highest tax bracket 90% like it used to be. Of course the corporate-funded Republicans and Democrats won’t do this without pressure.
The Green Party has been explicitly calling for taxing the rich; they deserve our support. Your Green vote will put pressure on the Democrats to also support taxing the rich.
VOTE GREEN!
July 26th, 2010 at 7:39 am -
mmm said:
once upon a time when Americans were victors and respected worldwide average income and average house prices were 7500 dollars….today average household income is 54,000…..
July 28th, 2010 at 11:26 am -
stephen verchinski said:
Wihat is the most troubling about the blame game is that the boomers were the ones who took responsibility for the additional money needed for social security income support while the Norquists of the world pillaged whenever and whereever they could. Now they want elimination of all public employee pensions even as they fatten up theirs.
“executives’ pensions or non-qualified deferred compensation (NQDC, think of that as a super-sized 401(k)) was showing some remarkably huge figures, particularly given the state of the economy.
Indeed, not so much NQDCs which were often invested in company stock, but SERPs (supplemental executive retirement benefits) seemed to be one of the few items of compensation that seemed unaffected by the downturn”
January 1st, 2011 at 9:49 pm
 If you enjoyed this post click here to subscribe to a complete feed and stay up to date with today’s challenging market!